All published articles of this journal are available on ScienceDirect.

The Effectiveness and Safety of Calcium Carbonate Use in Chronic Kidney Disease Patients with Normophosphatemia
Abstract
Background:
Patients with early and moderate stages of chronic kidney disease (CKD) have normal serum phosphate levels. Increased fibroblast growth factor-23 (FGF23) levels in these patients are responsible for maintaining normophosphatemia status by increasing the excretion of phosphate through urine. However, an increased serum FGF23 level is related to cardiomegaly, vascular calcification, CKD progression, and mortality. This study aimed to examine the effectiveness and safety of calcium carbonate use in stage 3 or 4 CKD patients with normophosphatemia.
Methods:
This double-blind randomized controlled trial (ClinicalTrials.gov identifier NCT03550534) included stage 3 or 4 CKD patients with normophosphatemia who visited the nephrology or endocrinology clinic at Dr. Cipto Mangunkusumo Hospital. Forty-six subjects were randomized to receive either calcium carbonate or placebo over a 12-weeks period. Urine phosphate, serum phosphate, serum calcium, and serum intact FGF23 levels were measured before and after the intervention.
Results:
The baseline characteristics of the two groups were similar, except for the higher prevalence of dyslipidemia in the placebo group. The CaCO3 group had shown reduced levels of FGF23 compared to the placebo group, -8.03 vs. 0.15 pg/ml respectively (p = 0.019). The median level of FGF23 showed a significant decrease only in the CaCO3 group. An increase in eGFR and a slightly decrease in urine phosphate were observed in the CaCO3 group; however, the data was found to be statistically not significant. No significant changes were noted in the serum calcium levels in both groups.
Conclusion:
The administration of calcium carbonate has been shown to be effective and safe for moderate CKD patients with normophosphatemia due to its effect in lowering FGF23 levels without escalating the serum calcium level.
1. INTRODUCTION
Chronic Kidney Disease (CKD) patients are more susceptible to premature death due to cardiovascular disease. The prevalence of cardiovascular disease in CKD patients increases with the progression of kidney disease. In addition to traditional cardiovascular risk factors, abnormalities in bone and mineral metabolism, such as calcium and phosphate, are considered to be one of the contributing factors causing cardiovascular events, particularly in CKD patients. One of the most important regulators of mineral metabolism is fibroblast growth factor-23 (FGF23), which is known to be independently associated with adverse cardiovascular effects, CKD progression, and mortality [1-3].
FGF23 is a phosphaturic hormone which causes urinary phosphate excretion. It has been suggested that the normal concentration of serum phosphate in the early to moderate stage of CKD is related to increasing levels of FGF23 as part of a physiologic response to hyperphosphatemia. However, increased FGF23 levels have also been shown to be associated with cardiomegaly, vascular calcification, CKD progression, and mortality [1].
The physiological actions of FGF23 are mediated through the FGFR-
Decreasing serum phosphate levels with the administration of phosphate binders may reduce FGF23 levels in patients with CKD. As hypocalcemia is often seen with hyperphosphatemia in patients with CKD, calcium-containing phosphate binder is the most common form prescribed [3, 6, 7]. However, there are concerns regarding the adverse effects due to excessive calcium exposure, particularly in CKD patients. Limited studies have investigated the efficacy of phosphate binders in decreasing FGF23 levels in CKD patients with normophosphatemia, and their results are still controversial [1]. Considering the potential factor of phosphate binder in CKD patients, the objective of this study was to examine the effectiveness and safety of calcium carbonate use in early to moderate CKD patients with normophosphatemia.
2. METHODS
2.1. Study Population
This parallel, double-blind randomized controlled trial was performed at the nephrology or endocrinology outpatient clinic of Dr. Cipto Mangunkusumo Hospital (ClinicalTrials.gov identifier NCT03550534). The study participants were recruited consecutively. Stage 3 or 4 CKD patients who had normal serum phosphate levels and agreed to participate in the study were included. Subjects who had a body mass index (BMI) of less than 18.5 kg/m2 or more than 30 kg/m2, and consumed drugs that could interfere with bone mineral metabolism (vitamin D analogs, such as calcitriol, alfacalcidol, and paricalcitol), were excluded. Based on the sample size formula for the superiority trial, 46 subjects were required to be involved in the present study.
2.2. Intervention
The subjects were randomized to receive either calcium carbonate 500 mg or placebo capsules, three times/day taken with meals for a 12-weeks period. The capsules were saved in a bottle with a different number according to the randomization process. Oral calcium carbonate and placebo were obtained from the Pharmacy Department, Faculty of Medicine, Universitas Indonesia. A simple randomization process for the intervention was performed by a pharmacist with a random number generator. Every four weeks, the subjects’ compliance and adverse events were assessed. The subjects, care providers, and investigators who collected the data, performed the analysis, and assessed the outcomes were blinded to the intervention.
2.3. Outcome Measurement
Before and after the intervention, laboratory tests were performed. The laboratory tests included serum intact FGF23, serum phosphate, urine phosphate, ionized calcium, serum calcium, urea, creatinine, estimated glomerular filtration rate (eGFR), and serum albumin tests. In total, 5 mL of venous blood was collected in a non-fasting state and added to an EDTA-anticoagulated container (BD Vacutainer®). For the urine phosphate test, the urine was collected over 24-hour in a urine collector (SY Easy Fold 24-hour Urine Collector). The serum intact FGF23 level was measured using an enzyme-linked immunosorbent assay (ELISA) kit for FGF23 from Cloud-Clone Corp., USA (detection range 15.6-1,000 pg/mL). The primary outcome of the study was the effectiveness of calcium carbonate administration, which was indicated by the changes in serum intact FGF23 level. Safety outcomes included treatment-emergent adverse events, which were specifically indicated by the serum calcium level.
2.4. Statistical Analysis
Data were analyzed by using SPSS version 23. A minimum sample size of 23 subjects per group was calculated using a power of 80%. The patients’ characteristics are presented as a percentage for categorical data, whereas numerical data are presented in median (min-max). Comparative analysis before and after the intervention was performed using the nonparametric t-test and Wilcoxon Test. The delta changes of the measured variables between the groups were compared using Man Whitney Test. The data were considered statistically significant if the p-value was < 0.05.
3. RESULTS
3.1. Characteristics of the Subjects
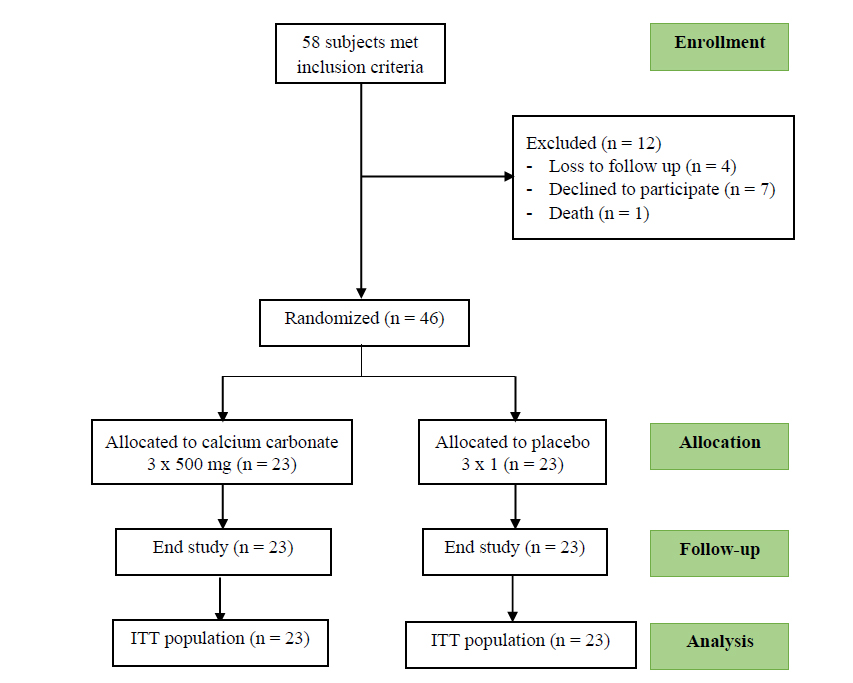
Of the 58 total patients recruited for the present study, 46 were included in the analysis. 12 patients were excluded from the study due to loss of follow-up, their decline to participate, and death (Fig. 1). The baseline characteristics of both groups were similar, except for a higher prevalence of dyslipidemia in the placebo groups (45.3%). The prevalence of hypertension and type 2 diabetes mellitus was 84.8% and 58.7%, respectively, in the study population (Table 1).
3.2. Effectiveness and Safety of Calcium Carbonate Use in CKD Patients with Normophosphatemia
Biochemical results obtained before and after intervention are presented in Table 2. Compared with the placebo group, the subjects in the CaCO3 group had significant reduction in the range of FGF23 levels [changes in FGF23 0.15 (-73.96 – 63.68) vs -8.03 (-46.57 – 14.91) pg/ml, respectively], with a p-value = 0.019 (Fig. 2a and Table 2).
In addition, the median of FGF23 levels before and after intervention significantly decreased but only in the CaCO3 group, from 35.97 to 29.16 pg/ml, with a p-value <0.001 (Fig. 2b and Table 3).
An increase in eGFR was also observed in the CaCO3 group, from median 32.5 to 37.1 mL/min/1.73 m2; however, the number was not statistically significant. Although a slight decrease was observed in urine phosphate of the CaCO3 group, the difference was not found to be significant before and after the treatment. Until the end of the study, no significant changes were noted in other laboratory parameters in both the groups, including serum calcium levels (p=0.217). Serum calcium levels before and after intervention in CaCO3 groups also showed no significant difference (Table 4). In addition, no side effects were observed in the two groups throughout the study.
| - |
Total (n = 46) |
Placebo Group (n = 23) |
CaCO3 Group (n = 23) |
| Sex | - | - | - |
| Male | 28 (60.9 %) | 13 (28.3%) | 15 (32.6%) |
| Female | 18 (39.1%) | 10 (21.7%) | 8 (17.4%) |
| Age (Year) | 62 (37-74) | 63 (49-74) | 62 (37-71) |
| Body Mass Index (kg/m2) | 24.83 (18.20 – 31.90) |
25.30 (18.20 – 31.90) |
23.90 (18.80 – 31.20) |
| Stage of CKD Stage 3A Stage 3B Stage 4 |
- 12 (26.1%) 18 (39.1%) 16 (34.8%) |
- 4 (8.7%) 12 (26.1%) 7 (15.2%) |
- 8 (17.4%) 6 (13%) 9 (19.6%) |
| Systolic Blood Pressure (mmHg) | 131 (104 – 162) | 130 (104 – 150) | 132 (113 – 162) |
| Diastolic Blood Pressure (mmHg) | 71 (55-90) | 72 (55 – 90) | 70 (59 – 87) |
| Type 2 Diabetes Mellitus | 27 (58.7%) | 14 (30.4%) | 13 (28.3%) |
| Hypertension | 39 (84.8%) | 20 (43.5%) | 19 (41.3%) |
| Dyslipidemia | 31 (67.4%) | 20 (43.5%)* | 11 (23.9%) |
| Cardiovascular Disease Congestive Heart Failure Coronary Heart Disease |
10 (21.7%) 4 (8.7%) |
4 (8.7%) 2 (4.3%) |
6 (13%) 2 (4.3%) |
| Serum Phosphate (mg/dL) | 3.50 (1.90 – 4.50) | 3.5 (2.40 – 4.40) | 3.5 (1.90 – 4.50) |
| Urine Phosphate (mg/dL) | 0.4 (0.1-14.4) | 0.4 (0.2-1) | 0.35 (0.1-14.4) |
| Intact FGF23 (pg/mL) | 29.16 (7.16 – 102.23) |
25.63 (7.16 – 102.23) |
35.97 (10.22 – 75.64) |
| Ionized Calcium (mmol/L) | 1.15 (0.90 – 1.28) | 1.16 (1.05 – 1.28) |
1.14 (0.90 – 1.28) |
| Serum Calcium (mg/dL) | 9.10 (7.80 – 10.10) | 9.10 (7.80 – 10.10) |
9.25 (8.10 – 10.10) |
| Serum Urea (mg/dL) | 46.00 (25.00 – 96.00) |
46.00 (25.00 – 89.00) |
53.00 (26.00-96.00) |
| Serum Creatinine (mg/dL) | 1.8 (1 – 4.3) | 1.8 (1.30 – 3.60) | 2.10 (1.00 – 4.30) |
| eGFR (mL/min/1.73 m2) | 35.50 (16.30 – 57.30) |
36.30 (16.90 – 57.30) |
32.5 (16.4 – 56) |
| Serum Albumin (g/dL) | 4.31 (2.85 – 5.04) | 4.31 (3.90 – 4.74) | 4.31 (2.85 – 5.04) |

| - | Placebo Group | Calcium Carbonate Group | P-Value | ||||
| Before (T1) | After (T2) | Delta () | Before (T1) | After (T2) | Delta () | ||
| Serum Phosphate (mg/dL) | 3.5 (2.40 – 4.40) |
3.7 (2.30 – 4.60) |
0.1 (-1.00 – 1.80) |
3.5 (1.90 – 4.50) |
3.8 (2.40 – 4.40) |
0 (-1.00 – 1.63) |
0.916 |
| Urine Phosphate (mg/dL) | 0.4 (0.2 – 1.0) |
0.45 (0.20 -0.90) |
0.1 (-0.7 – 0.5) |
0.35 (0.1 – 14.4) |
0.3 (0.1 – 0.6) |
0 (-14 – 0.5) |
0.087 |
| Intact FGF23 (pg/mL) | 25.63 (7.16 – 102.23) |
30.65 (7.31 – 78.44) |
0.15 (-73.9 – 63.68) |
35.97 (10.22 – 75.64) |
29.16 (8.96 – 43.85) |
-8.03 (-46.57 – 14.91) |
0.019* |
| Ionized Calcium (mmol/L) | 1.16 (1.05 – 1.28) |
1.12 (1.02 – 1.27) |
-0.035 (-0.22 – 0.10) |
1.14 (0.90 – 1.28) |
1.17 (1.04 – 1.30) |
- 0.30 ( -0.02 – 0.34) |
0.225 |
| Serum Calcium (mg/dL) | 9.10 (7.80 – 10.10) |
9.50 (18.60 – 10.10) |
0.3 ( -0.70 – 1.40) |
9.25 (8.10 – 10.10) |
9.10 (8.30 – 10.70) |
0 (-1.20 – 1.00) |
0.217 |
| Serum Urea (mg/dL) | 46 (25 – 89) | 45 (17-91) | 2 (-28 – 18) | 53 (26-96) | 44 (23 – 90) | 0 (-42 – 24) | 0.664 |
| Serum Creatinine (mg/dL) | 1.8 (1.30 – 3.60) |
1.70 (1.00 – 3.20) |
0 (-0.50 – 0.50) |
2.10 (1.00 – 4.30) |
1.70 (0.70 – 4.80) |
0 (-1.30 – 1.20) |
0.713 |
| eGFR (mL/min/1.73 m2) | 36.30 (16.90 – 57.30) |
36.80 (16.80 – 62.70) |
-0.1 (-9.00 – 16.70) |
32.5 (16.4 – 56) |
37.1 (14.3 – 97.7) |
0 (-11.8 – 42.2) |
0.589 |
| Serum Albumin (g/dL) | 4.31 (3.90 – 4.74) |
4.45 (3.40 – 5.00) |
0.03 (-0.57 – 0.56) |
4.31 (2.85 – 5.04) |
4.16 (3.32 – 4.97) |
-0.16 (-0.10 – 0.66) |
0.220 |
| Intervention Group | Subjects | Mean (pg/ml) | p-value |
| Before | 23 | 35.97 | <0.001 |
| After | 23 | 29.16 |
| Intervention Group | Subjects | Mean (pg/ml) | p-value |
| Before | 23 | 9.25 | 0.822 |
| After | 23 | 9.10 |
4. DISCUSSION
4.1. Characteristics of the Subjects
The studied participants were stage 3 or 4 CKD patients with normophosphatemia who visited the nephrology or endocrinology outpatient clinic of Dr. Cipto Mangunkusumo Hospital. The median age of the study population was 62 (37-74) years. Similar to our findings, Prakash et al. (2009) reported an increase in the prevalence of CKD in the elderly population [8]. Elderly individuals, particularly those with hypertension or type 2 diabetes mellitus, were more susceptible to developing kidney disease than adults. We observed a high prevalence of hypertension and type 2 diabetes mellitus in the present study (84.8% and 58.7%, respectively) [4]. As per the 8th report of the Indonesian Renal Registry, hypertension and type 2 diabetes mellitus are the most common etiologies of CKD in Indonesia [9].
The median BMI of the study population was 24.83 kg/m2, which is classified as overweight. Bayliss et al. (2012) reported that obesity causes hyperfiltration and reduced oxidation of fatty acids. Increased fatty acid levels result in decreased adiponectin levels and lead to podocyte effacement and increased nicotinamide adenine dinucleotide phosphate (NADPH) oxidase levels [10].
In the present study, we observed normal levels of serum calcium and ionized calcium levels (9.10 (7.80 – 10.10) and 1.15 (0.90 – 1.28) mmol/L, respectively). This result is similar to that of Langman et al. (2010), who reported normal serum calcium levels in moderate CKD patients [11]. We also observed a normal median serum phosphate level (3.50 mg/dL). This result indicates that the normophosphatemia state in moderate CKD patients is associated with increased FGF23 levels, which increase the excretion of phosphate through urine [1].
The median of FGF23 level prior to intervention in this study was 29.16 (7.16 – 102.23) ng/dl. This result differs from that of Fliser et al. (2007), who reported a mean FGF23 level of 43 ± 26 ng/dl. A serum FGF23 level of more than 35 pg/ml has been reported to be associated with a significant increase in CKD progression. Moreover, an increased level of FGF23 level is associated with secondary hyperparathyroidism via the inhibition of the 1α-hydroxylase enzyme, a 1.25-vitamin D synthesis regulator [12].
4.2. Effectiveness and Safety of Calcium Carbonate Use in CKD Patients with Normophosphatemia
Calcium carbonate administration was found to be effective in reducing the serum FGF23 levels. In the present study, the FGF23 levels in the CaCO3 group significantly decreased compared with those in the placebo group, i.e. -8.03 (-46.57 – 14.91) vs. 0.15 (-73.96 – 63.68) pg/ml, respectively (p-value = 0.019). This result differs from that of Soriano et al. (2013), who compared the calcium carbonate and lanthanum carbonate levels in non-dialysis subjects. They observed a significant decrease in the level of FGF23 in the lanthanum carbonate group, but no significant changes in the FGF23 levels in the calcium carbonate group have been observed [13]. In addition, they also observed a significant decrease in fractional excretion of phosphate as well as urine phosphate/creatinine ratio in the lanthanum carbonate group. Those differences in the results were possibly due to the different baseline characteristics of the subjects in both studies; in particular, a study was conducted by Soriano et al. on stage 4-5 CKD patients, in which the CKD stage was more advanced compared to our subjects, along with hyperphosphatemia state and higher FGF23 baseline.
In some studies, a second phosphate binder was added to calcium carbonate in order to further decrease the FGF23 level. This effect was reported by Shigematsu et al. (2012), who combined lanthanum carbonate and calcium carbonate to reduce the FGF23 levels in their study population. They reported a greater decrease in the FGF23 levels produced by lanthanum carbonate and calcium carbonate, compared to calcium carbonate alone. This effect was observed as a result of the increased binding of phosphate in the intestine, resulting in increased excretion of phosphate through urine. A decrease in the level of phosphate absorbed in the intestine decreases the serum phosphate level and impacts the decrease in the FGF23 level [14].
An increase in eGFR level was observed in the intervention groups; however, the data was not found to be statistically significant. Although there is no evidence of a direct relationship between FGF23 level and eFGR level, Larrson et al. (2003) found FGF23 to be significantly elevated in patients with CKD, and its concentration has also been correlated with renal creatinine clearance. However, in the study conducted by Larrson, the subjects involved more varied stages of CKD [15]. Fliser et al. (2007) studied mild to moderate CKD patients and showed the decrease of renal function across a wide range of GFR to be in parallel with a marked increase in intact FGF23 blood concentrations. This result was also supported by the statement that FGF23 levels increase along with the deterioration of renal function in the presence of progressive CKD [12].
A slight decrease in urine phosphate level was also observed in the intervention groups; however, the data showed no significant results. Although the unit was different, Soriano et al. (2013), who examined the effects of phosphate binders on FGF23 levels in CKD patients, also showed no change of urine phosphate/creatinine ratio in calcium carbonate groups compared with lanthanum carbonate groups [13].
Lastly, no significant changes were noted in the ionized calcium and serum calcium levels, indicating that calcium carbonate administration is safe for CKD patients with normophosphatemia. This result differs from that of Hill et al. (2013), who reported an increase in the serum calcium level on the administration of a calcium-based phosphate binder that resulted in vascular calcification. In that study, the subjects received 3 x 500 mg calcium carbonate with 1 gram daily calcium intake [16]. This different result may have occurred due to the addition of daily calcium intake, although calcium dietary intake in the present study was not measured appropriately. Besides, total elemental calcium intake from both dietary and calcium-based phosphate binders is recommended to not exceed 2000 mg/day since excessive calcium intake leads to a large positive calcium balance. However, Kidney Disease Improving Global Outcomes (KDIGO) 2016 has recommended maintaining normal serum calcium levels in CKD patients. Hypocalcemia results in secondary hyperparathyroidism, while hypercalcemia causes vascular calcification [17].
This study was a double-blind randomized controlled trial that assessed the effectiveness and safety of calcium carbonate in normophosphatemic CKD patients with FGF23 as the laboratory parameter. Our study adhered to the CONSORT guidelines. A few limitations have been involved in our study; first, this was a small study with a small sample size. There was no measurement of parathyroid hormone (PTH) that could be affected by calcium carbonate administration. We also did not measure calcium dietary intake of the subjects to define the exact calcium balance. In addition, long-term effects of calcium carbonate, such as cardiovascular events, mortality, CKD progression, and calcification, were not observed in the present study. Despite its limitation, this study also possesses strength; the participants were all naïve to drugs so there was no interference of bone metabolism, thereby avoiding another confounding factor.
CONCLUSION
In conclusion, the administration of calcium carbonate can reduce FGF23 levels without escalating both ionized calcium and serum calcium levels in stage 3 or 4 CKD patients. These results indicate that the use of calcium carbonate is effective and safe for moderate CKD patients with normophosphatemia.
LIST OF ABBREVIATIONS
| BMI | = Body Mass Index |
| CKD | = Chronic Kidney Disease |
| eGFR | = Estimated Glomerular Filtration Rate |
| FGF23 | = Fibroblast Growth Factor-23 |
| ITT | = Intention to Treat |
| KDIGO | = Kidney Disease Improving Global Outcomes |
| NADPH | = Nicotinamide Adenine Dinucleotide Phosphate |
| PTH | = Parathyroid Hormone |
AUTHORS’ CONTRIBUTIONS
PN initiated and designed the study, contributed to statistical analysis and data interpretation, and wrote the original manuscript. MB initiated and designed the study, contributed to data interpretation, and revised the manuscript. BY and CA collected the data, contributed to statistical analysis and drafted the manuscript. CAN took part in drafting of the manuscript. AL supervised the study. All the authors have reviewed and approved the final manuscript.
ETHICS APPROVAL AND CONSENT TO PARTICIPATE
All procedures involved in the present study were approved by the Health Research Ethics Committee, Faculty of Medicine, Universitas Indonesia, and Dr. Cipto Mangunkusumo Hospital, Jakarta, Indonesia.
HUMAN AND ANIMAL RIGHTS
No animals were used for studies that are the basis of this research. All the human procedures used were in accordance with the ethical standards of the committee responsible for human experimentation (institutional and national), and with the Helsinki Declaration of 1975, as revised in 2013 (http://ethics.iit.edu/ecodes/node/3931).
CONSENT FOR PUBLICATION
Informed consent was obtained from all the study participants.
STANDARDS OF REPORTING
CONSORT guidelines were followed in the study.
AVAILABILITY OF DATA AND MATERIALS
The datasets used and/or analyzed in the present article are available from the corresponding author on reasonable request.
CONFLICT OF INTEREST
The authors declare no conflict of interest, financial or otherwise.
FUNDING
The present study was financially supported by Dr. Cipto Mangunkusumo Hospital Research Grant 2015.
ACKNOWLEDGEMENTS
Declared none.

