All published articles of this journal are available on ScienceDirect.

Financial Relationships between Industry and 2023 AUA Annual Meeting Speakers
Authors Info & Affiliations
Abstract
Introduction
This study aimed to analyze the industry relationships and industry payments for the American Urological Association (AUA) 2023 annual meeting plenary speakers. We focused on the financial contributions of these opinion leaders to urology.
Materials and Methods
We used the Centers for Medicare and Medicaid Services (CMS) Open Payments Database, cross-referencing it with the 2023 AUA plenary speakers list, covering payments from 2015-2022, focusing on 2022. The analysis included categorization by provider training, geographic section, subspecialty, H-index, and guideline panel involvement, using median, interquartile range, frequency, and proportion for statistical analysis.
Results
An analysis of 171 U.S.-based AUA 2023 plenary speakers identified medical oncology as the highest-compensated subspecialty in 2022. Notably, 24% received over $100,000 between 2015-2022, and 7% exceeded $50,000 in 2022. Among AUA or National Comprehensive Cancer Network (NCCN) guideline panel members, 48% received over $50,000 over seven years, and 34% received over $10,000 in 2022.
Conclusion
The study revealed substantial financial relationships between the industry and AUA 2023 plenary speakers, especially those on guideline panels, with most payments in the form of consulting fees. The findings highlighted the importance of transparency and ethical considerations in urology, given the potential influence of these financial ties on medical decision-making and guideline development.
1. INTRODUCTION
In the landscape of academic medicine, the interplay between industry and physicians has garnered significant attention, particularly in urology [1]. In 2014, urology was the 8th most compensated specialty in non-research payments from industry for practicing urologists within the United States [2]. While pivotal for advancing medical research and patient care, this relationship has comp-lexities. The essence of these interactions often lies in the delicate balance between fostering innovation and maintaining the integrity of clinical and academic decision-making. The American Urological Association (AUA) plenary sessions, featuring some of the most esteemed and influential urologists and specialists in the United States, represent a focal point where the impact of these industry-physician relationships is both pronounced and consequential.
The concept of Conflict of Interest (COI) and the necessity for disclosures in the medical field are well-established. These disclosures are intended to provide transparency when a physician's financial ties might unduly influence their clinical or research decisions, potentially impacting patient care or scientific integrity [3, 4]. However, conventional COI disclosures often fall short of capturing the depth and breadth of these financial relationships, leading to a gap in understanding the true extent of potential industry influence. In a study of presentations at ASTRO meetings over three years, nearly a third of presenters displayed their COI slides in a manner that was not understandable to the average audience [5].
The Physician Payments Sunshine Act, a component of the Affordable Care Act, mandates the disclosure of financial transactions between healthcare providers and the pharmaceutical and medical device industries [6, 7]. This legislation, administered by the Centers for Medicare & Medicaid Services (CMS), aims to bring transparency to these financial relationships. In urology, the Sunshine Act is a critical tool for scrutinizing the financial interactions between industry and healthcare professionals, particularly those in influential positions, such as AUA plenary speakers.
Despite the availability of comprehensive financial data, there is still a notable gap in research specifically focused on quantifying and characterizing the relationships between industry and AUA plenary speakers. This gap is particularly significant considering recent findings from a research letter that revealed extensive industry payments to American editorial board members of major urology journals [1]. Given the stature and influence of AUA plenary speakers in shaping the field of urology, comprehending the extent and nature of their industry relationships is crucial. It is imperative to determine whether the financial ties of these key opinion leaders have the potential to influence clinical practices, research directions, or educational content within the urological community, like the concerns raised about editorial decision-making in academic journals.
Therefore, the primary objective of our study was to characterize and quantify the financial relationships between industry and AUA 2023 plenary speakers. By leveraging the data available through the Sunshine Act, this research study aimed to provide a comprehensive overview of these interactions, offering insights into the nature and magnitude of industry payments and perhaps informing the development of a more comprehensive and transparent COI disclosure process.
2. MATERIALS AND METHODS
2.1. Data Source
The data for this study were derived from two primary sources. The first source was the CMS Open Payments Data (openpaymentsdata.cms.gov), as mandated by the Sunshine Act. This database provides comprehensive information on payments made by healthcare companies to physicians and teaching hospitals, including but not limited to payment amounts, number of payments, the companies making the payments, the nature of the payment (e.g., consulting fees, food and beverage expenditure, etc.), and the date of the payment. These payments reflect compensation for activities and contributions outside of the Annual Meeting, not for speaking engagements at the session itself. The second data source was the list of plenary speakers for the AUA Annual Meeting in 2023, which was collected directly from the official AUA conference program (https://www.aua2023.org/). For our study, we obtained the H-index of each AUA 2023 plenary speaker using Scopus, a comprehensive and reliable database for academic citation analysis.
In this study, we first compiled a comprehensive list of plenary speakers for the 2023 AUA Annual Meeting. From this list, we identified individuals who also served on any AUA guideline panel, encompassing a broad spectrum of urological disciplines. Additionally, we identified plenary speakers who were members of the National Comprehensive Cancer Network (NCCN) guideline panels specifically related to bladder, kidney, adrenal, penile, prostate, and testicular cancers. This approach enabled the identification of a subset of AUA plenary speakers who also contributed to guideline panels for both AUA and NCCN. This subset included speakers who served on guideline panels of both organizations, illustrating their extensive involvement in the development of clinical guidelines within the field of urology.
To ensure data compatibility and relevance, we included plenary speakers based in the United States only, excluding any international speakers from the analysis as they were not included in the Sunshine Act database. The CMS data and the AUA plenary speakers list were cross-referenced to identify overlapping individuals.
2.2. Data Collection
The CMS Open Payments Database, accessed in October 2023, provided detailed records of financial transactions between industry and healthcare providers. For this study, we focused exclusively on U.S.-based plenary speakers from the 2023 AUA Annual Meeting. Each speaker was individually queried within the database to retrieve data on non-research-related payments received from January 1, 2015, to December 31, 2022. Recognizing the importance of industry funding for critical research endeavors, such as drug studies, we deliberately excluded all research-related payments from our analysis. This approach allowed us to concentrate on non-research financial interactions. A focused examination of payments received in 2022 was also conducted, given its direct relevance to the timing of these presentations.
To assess the research impact and productivity of individuals, we determined the H-index for each plenary speaker and guideline panel. The H-indices were obtained through Scopus. The gender of each speaker and panel member was inferred by examining publicly accessible online resources. This included professional profiles, institutional websites, and other digital platforms where gender could be reasonably ascertained. Each plenary speaker was also categorized based on their AUA geographic section affiliation. This classification was essential to understanding geographical and regional trends in industry interactions and academic involvement within the field of urology.
2.3. Data Analysis
We systematically classified speakers from the 2023 AUA Annual Meeting based on a series of predefined criteria to analyze their professional profiles and academic contributions. The classification began with an evaluation of additional fellowship training, as indicated on the speakers' institutional or personal websites. This step helped to identify their urologic subspecialties, including whether they had completed training in programs accredited by the Society of Urologic Oncology (SUO) for urologic oncology, Genitourinary Reconstructive Surgeons (GURS) training for reconstructive surgery, or fellowships in pediatric urology, among others. For areas with potential overlaps, such as endourology and stone disease
| - | Number of US Speakers with Sunshine Data | Median Number of Payments in 2022 (IQR) | Median Total Amount of Payments in 2022 (IQR) | Median Total Payments in Sunshine (IQR) |
|---|---|---|---|---|
| Total speakers | 169 | 6 (1-20) | $1,238 ($58-$11,626) | $17,522 ($2,701-$95,274) |
| Subspecialty | ||||
| Oncology | 26 | 9 (1-21) | $2,719 ($161-$13,497) | $21,989 ($4,795-$118,728) |
| Endourology/stone disease | 32 | 8 (1-19) | $1,941 ($114-$10,754) | $19,318 ($4,674-$86,540) |
| FPMRS/neuro-urology | 18 | 13 (2-22) | $3,860 ($284-$14,237) | $32,420 ($8,558-$124,634) |
| Pediatrics | 11 | 2 (0-10) | $170 ($0-$963) | $3,156 ($691-$9,731) |
| Andrology/sex medicine | 23 | 6 (1-19) | $1,000 ($59-$10,914) | $15,498 ($2,702-$91,310) |
| Reconstruction | 21 | 7 (1-19) | $1,119 ($58-$10,952) | $16,510 ($2,702-$93,557) |
| Laparoscopy and robotics | 10 | 14 (4-26) | $6,224 ($479-$16,337) | $48,653 ($12,893-$152,341) |
| Medical oncology | 6 | 22 (9-49) | $14,815 ($4,255-$32,434) | $156,134 ($94,354-$253,514) |
| Radiation oncology | 4 | 8 (1-16) | $838 ($105-$6,572) | $14,342 ($6,795-$35,963) |
| None/other | 18 | 4 (1-16) | $504 ($47-$7,197) | $11,015 ($2,153-$50,963) |
| Region | ||||
| Mid-Atlantic | 14 | 8 (1-18) | $2,001 ($172-$10,516) | $19,336 ($5,390-$69,863) |
| New England | 10 | 8 (1-19) | $1,673 ($67-$10,991) | $17,748 ($3,156-$92,234) |
| New York | 18 | 10 (2-21) | $2,984 ($211-$12,804) | $24,831 ($6,795-$98,018) |
| North Central | 19 | 6 (1-18) | $756 ($54-$9,676) | $14,342 ($2,314-$65,821) |
| Northeastern | 7 | 4 (1-16) | $437 ($23-$5,721) | $10,460 ($1,785-$40,517) |
| Western | 36 | 8 (1-20) | $2,001 ($77-$12,355) | $19,336 ($4,264-$99,129) |
| South Central | 24 | 6 (1-19) | $1,000 ($56-$10,914) | $15,498 ($2,700-$93,159) |
| Southeastern | 27 | 8 (1-20) | $2,250 ($105-$13,197) | $20,035 ($4,509-$101,012) |
| North Central | 14 | 6 (1-17) | $609 ($55-$8,567) | $12,871 ($2,507-$57,077) |
| Gender | ||||
| Male | 120 | 7 (1-20) | $1,673 ($67-$12,185) | $17,748 ($2,704-$95,794) |
| Female | 49 | 6 (1-18) | $845 ($54-$10,568) | $14,690 ($2,410-$81,346) |
| Guideline panels | ||||
| AUA | 53 | 8 (1-20) | $2,001 ($83-$12,242) | $19,336 ($4,273-$96,906) |
| NCCN | 18 | 14 (3-25) | $4,283 ($287-$15,009) | $41,375 ($10,802-$140,514) |
| AUA and NCCN | 13 | 14 (3-25) | $4,283 ($293 - $14,815) | $41,375 ($10,909 - $140,320) |
| Neither | 111 | 6 (1-19) | $1,238 ($59 - $11,067) | $17,522 ($2,704-$94,753) |
or robotics and laparoscopy, the classification was based on the specialization explicitly mentioned on their websites. This method was consistently applied across other subspecialties, including Female Pelvic Medicine and Reconstructive Surgery (FPMRS) and andrology, as well as for medical and radiation oncologists.
Additionally, the speakers were categorized by their association with specific AUA geographical sections to understand regional representation. The subspecialty focus of their plenary talks was also considered, although a direct correlation between the talk content and their financial disclosures was not possible.
The H-index was utilized as an indicator of academic productivity, serving as a measure of the impact and quantity of a speaker's scholarly publications. This index, which accounts for both the volume of an individual's publications and the frequency with which they are cited, offers a balanced assessment of their academic influence.
Finally, the involvement of speakers in guideline panels, particularly those associated with the AUA and the National Comprehensive Cancer Network (NCCN), was examined. This analysis aimed to identify individuals who contribute to setting clinical guidelines, thereby shaping practice patterns.
2.4. Statistical Analysis
Continuous variables were not normally distributed and, therefore, reported using median and Interquartile Range (IQR). Categorical variables, on the other hand, were presented as frequency and proportion. We calculated the Spearman correlation coefficient to assess the relationship between the H-index of plenary speakers and their industry payments.
The Kruskal-Wallis test was used to analyze 2022 payment differences across gender, AUA geographic sections, and urology subspecialties, identifying disparities and variations in industry compensation among these groups. All statistical tests were two-tailed, with a p-value of less than 0.05 considered to be statistically significant. All statistical analyses were performed using R software (version 4.1), ensuring accurate and reliable computation of results.
3. RESULTS
Our study analyzed data from 171 U.S.-based plenary speakers for the AUA 2023 Annual Meeting. Two speakers were not listed in the Open Payments database and were subsequently excluded from the analysis. The analysis results revealed a statistical difference in total payments received in 2022 among subspecialties (p <0.01). The medical oncology subspecialty received the highest compensation with a median of $14,815 and an IQR of $4,255 to $32,434. When assessing payments based on AUA sections, the New York section emerged as the highest compensated, with a median payment of $2,984 and an IQR of $211 to $12,804. However, the payment difference across sections was not statistically significant (p = 0.61). A comparative analysis of payments based on gender revealed that male speakers received higher total payments than their female counterparts. The median payment for male speakers in 2022 was $17,748 (IQR: $2,704–$95,794), whereas for female speakers, it was $14,690 (IQR: $2,410–$81,346). This difference approached, but did not reach, statistical significance (p = 0.07) (Table 1). Although the H-index was calculated for each speaker, no significant correlation was found between the H-index and the extent of industry payments received. The data showed a modest positive correlation (Spearman coefficient = 0.34, p < 0.01), suggesting that more academically productive individuals tend to receive higher payments.
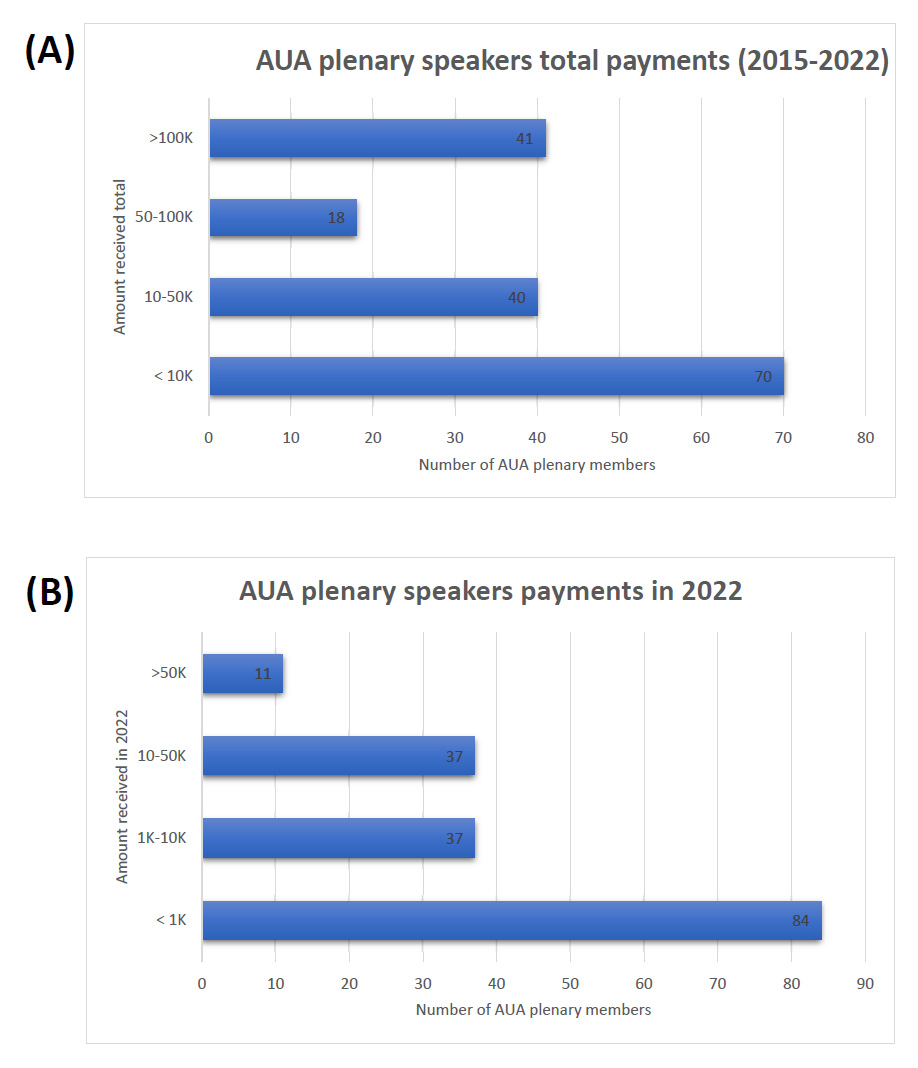
Distribution of payments for all plenary speakers.
Part A: Number of AUA plenary speakers in each payment category over the years 2015-2022. The categories are divided into > $100K, $50K - $100K, $10K - $50K, and < $10K.
Part B: Distribution of payments to AUA plenary speakers for the year 2022. The payments are categorized into > $50K, $10K - $50K, $1K - $10K, and < $1K.
Notably, of the AUA 2023 plenary speakers, 24% received over $100,000 in total payments in the seven years (2015 – 2022). In 2022, 7% of the speakers received over $50,000, and 28% received over $10,000 in the same year (Fig. 1).
Fig. (2) provides a detailed visualization of the distribution of payments to plenary speakers who also served on AUA and NCCN guideline panels. Of the members serving on AUA or NCCN guideline panels, 48% received payments exceeding $50,000 over the seven years. In 2022, approximately 34% of the guideline panel members received payments exceeding $10,000.
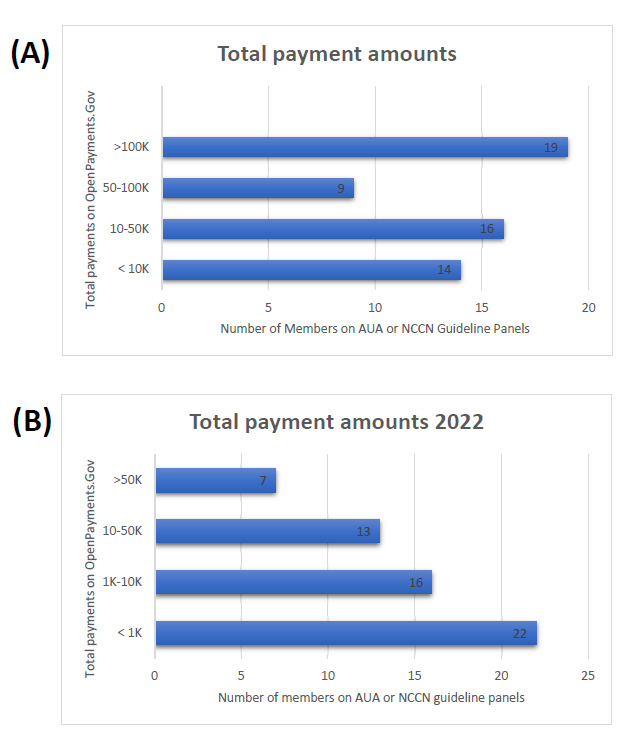
Distribution of payments for AUA plenary speakers on guideline panels.
Part A: Number of AUA plenary speakers serving on either AUA or NCCN guideline panels in each payment category over the years 2015-2022. The categories are divided into > $100K, $50K - $100K, $10K - $50K, and < $10K.
Part B: Distribution of payments to AUA plenary speaker serving on either AUA or NCCN guideline panels for the year 2022. The payments are categorized into > $50K, $10K - $50K, $1K - $10K, and < $1K.
For the entire cohort of plenary speakers, most payments were categorized as consulting services, accounting for 50% of all payments (Fig. 3). This was followed by 31% categorized as “other payments”, which did not include research funds, encompassing various forms of compensation not explicitly defined as consulting or honoraria. Only a small fraction, i.e., 5%, constituted honoraria. Among the AUA guideline panel members who were also plenary speakers, consulting fees again constituted the majority, representing 43% of payments. However, the proportion of payments classified as 'other' was slightly higher at 40%, followed by 8% in honoraria. The NCCN guideline panel members showed that 66% of their payments were for consulting, with other compensation accounting for 24%.
4. DISCUSSION
Our study focused on quantifying and characterizing the financial compensations received by AUA 2023 plenary speakers from the industry, and the results reflected the industry's significant relationships with urologists. With industry contributions to urologists reaching $32.7 million in 2022, our research shed light on the underlying financial dynamics at influential medical conferences [8]. This analysis sought to provide a detailed overview of financial relationships.
Our study examined the financial ties between AUA plenary speakers and the healthcare industry. Previous analyses have shed light on the financial interactions within the realm of urology, revealing that nearly 50% of guideline authors have received more than $10,000 in a single year from the industry, with 37% of the guideline author disclosure statements being inaccurate [9]. Additionally, the median payments to editorial board members in urology have been reported to exceed those typically received by the broader urologist community [10]. Our study aligned with these findings, indicating that in 2022, 7% of AUA plenary speakers earned over $50,000, and among those AUA plenary speakers serving on guideline panels, 12% received payments exceeding this amount.
We also examined geographic distribution trends by analyzing AUA geographic sections. Previous research indicated that in 2018, the Southeastern, North Central, and Western sections had the largest median annual payments, with reported median payments per urologist of $562, $317, and $209, respectively [11]. Our findings showed a similar geographic distribution, with New York, Southeastern, Western, and Mid-Atlantic sections receiving the highest annual payments. However, the median payments for AUA speakers in 2022 were substantially higher than those for the average urologist, with the Southeastern, North Central, and Western sections receiving median payments of $2,250, $756, and $2,001, respectively. Given previous evidence that male urologists receive more total funding and higher median payments than their female counterparts, we assessed the AUA plenary speakers for similar disparities [11]. Our
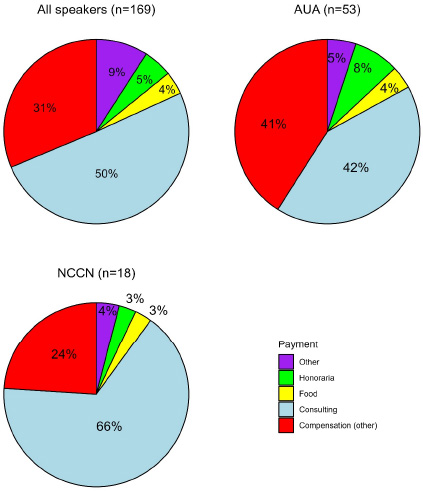
Distribution of payments.
analysis confirmed that male speakers received more funding in total and annually compared to their female counterparts. This observed disparity aligned with trends documented in other surgical specialties, including ortho-pedics and cardiology, where gender-based differences in industry compensation have been well established [12-14]. These findings underscore the need for further exploration of systemic factors that contribute to these disparities.
Previous analyses of payments to urologists across various specialties revealed distinct trends in compen-sation. Over a five-year study period, oncologic urologists collectively received the largest total payments, while reconstructive urologists possessed the highest median total payment, exceeding $4,000 per provider. Urologists specializing in Female Pelvic Medicine and Reconstructive Surgery (FPMRS) and andrology reported median payments of over $3,000 [11]. Our findings aligned with these trends, identifying laparoscopy/robotics, FPMRS, oncology, and endourology as the subspecialties with the highest payments from the industry. Notably, median payments for urologic oncology among AUA plenary speakers were significantly higher than in previous studies, with FPMRS and endourology showing similar patterns. The most substantial payments were observed in medical oncology, aligning with studies focused on novel pharmaceuticals. While most payments to medical oncologists were modest, a subset, representing 1% of all medical oncologists, received over $100,000 annually, accounting for 37% of all industry payments in this specialty. Interestingly, nearly a quarter of these high-earning medical oncologists were found to serve on journal editorial boards, and 10% have authored clinical practice guidelines [15]. This highlights the significant financial involvement of key opinion leaders in medical oncology with the industry, underscoring the importance of transparency.
Our analysis revealed that consulting fees made up a significant portion of the payments to AUA plenary speakers, reflecting the industry's reliance on these experts for advisory roles, educational initiatives, and input on product development. This finding aligned with previous reports where consulting and speaker's fees constituted the largest percentage of reported financial relationships in the field [16]. While earlier studies have indicated that food and beverage expenses account for most of the industry spending for all urologists, our focused analysis of AUA plenary speakers, recognized as thought leaders, showed a different trend. In this group, most payments were consulting and speaking fees, typically being much higher than other types of compensation [11]. This shift under-scores the elevated status and influence of AUA plenary speakers in the industry, reflecting their significant roles in shaping clinical practice and guidelines.
Our final analysis included a detailed examination of the financial compensation provided to members of AUA and NCCN guideline panels who were also AUA plenary speakers. The data indicated that these individuals, who are recognized for their expertise and leadership within the field, tend to receive higher levels of compensation from the industry compared to the general cohort of urologists and even among the plenary speakers themselves. This finding was found to be in accordance with other specialties, such as medical oncology and ophthalmology [15, 17]. One study found that 25% of oncologic clinical guidelines authors had received non-research payments of more than $10,000 in a single year [18].
In the realm of academic urology, especially among AUA plenary speakers recognized as thought leaders, a symbiotic relationship with the industry is indispensable for conducting clinical trials and fostering innovation. While the financial contributions from these industry relationships constitute a minor fraction of an academic urologist's overall income, evidence suggests that even minimal interactions, such as a single industry-sponsored meal, can influence prescribing behaviors [19, 20]. It is complex to precisely delineate the impact of industry on medical decisions yet asserting that industry payments play no role would be misleading, as demonstrated by studies linking industry payments to favorable positions on the use of devices for treating lower urinary tract symptoms [21]. However, the positive aspects of such collaborations merit acknowledgment. Clinical and academic leaders signifi-cantly influence the strategic direction of pharmaceutical and medical device companies, using their expertise to steer product development in ways that ultimately benefit patient care. This complexity underscores the critical need for robust conflict-of-interest policies and transparent disclosures, ensuring that the valuable contributions of academic urologists to medical innovation and patient care are balanced with ethical standards and the preservation of trust in the medical profession. Given the pervasiveness of industry payments, professional societies must implement robust COI management strategies. Although disclosure policies exist, these alone may be insufficient to mitigate bias or undue influence. Professional organizations, such as the AUA, must strengthen their leadership in developing more comprehensive policies, possibly requiring active management and enforcement of COI standards beyond mere disclosure. Implementing standardized processes, including independent panels for guideline development and clear limits on financial engagement, can help address the potential for conflicts while maintaining industry collaboration.
The strength of our study was the utilization of official government data from the Sunshine Act, ensuring the reliability of financial information. However, the study was not without limitations. These included not accounting for the number of years in practice for each physician, reliance on reported data that may not capture all financial transactions, and the focus on U.S.-based speakers only. While this analysis has deliberately omitted research-related payments, there is a chance that some payments classified as general might pertain to research endeavors. While such misclassification could inflate the perceived income physicians receive from industry, it is improbable that this would significantly alter the findings of our study.
CONCLUSION
In conclusion, our analysis has meticulously documented the financial interactions between AUA 2023 plenary speakers and the healthcare industry, emphasizing the criticality of transparency and diligent conflict-of-interest management to preserve integrity and trust in the urological community. These interactions, while essential for the progression of urology, necessitate refined disclosure processes to guarantee transparency and objectivity in clinical guidance and research. The study advocates for the development of comprehensive and accessible COI disclosure protocols during professional gatherings, ensuring that the contributions of these relationships to urology are recognized without compromising ethical standards. However, addressing COI issues may require more than improved disclosure processes. Professional organizations must implement more proactive measures, including setting limits on financial engagements, establishing independent panels for guideline development, and mandating periodic training on COI management. Strengthening oversight and enforcement of these policies is essential to ensure that collaborations with industry are managed transparently and without compromising the integrity of clinical decisions. Further research is encouraged to understand the broader effects of these financial relationships on clinical decision-making and guideline development within the field.
AUTHORS’ CONTRIBUTION
C.S.: Study conception and design; Q.W., A.T.: Data collection; M.E.S., J.D.: Analysis and interpretation of results; J.D.: Drafting of the manuscript; E.K.L.: Conceptualization. All authors have reviewed the results and approved the final version of the manuscript.
LIST OF ABBREVIATIONS
| AUA | = American Urological Association |
| COI | = Conflict Of Interest |
| CMS | = Centers for Medicare & Medicaid Services |
| NCCN | = National Comprehensive Cancer Network |
| IQR | = Interquartile Range |
| FPMRS | = Female Pelvic Medicine and Reconstructive Surgery |
| GURS | = Genitourinary Reconstructive Surgeons |
| SUO | = Society of Urologic Oncology |
| FPMRS | = Female Pelvic Medicine and Reconstructive Surgery |
AVAILABILITY OF DATA AND MATERIALS
The data and supportive information are available within the article.
FUNDING
The authors were funded with salary support by the University of Kansas Medical Center, USA. Otherwise, no additional funding has been received.
ACKNOWLEDGEMENTS
Declared none.

