All published articles of this journal are available on ScienceDirect.

Elevated Tumor Necrosis Factor-α and Transforming Growth Factor-β in Prostatic Tissue are Risk Factors for Lower Urinary Tract Symptoms after Transurethral Resection of the Prostate in Benign Prostatic Hyperplasia Patients with Urinary Retention
Authors Info & Affiliations
Abstract
Background:
Lower Urinary Tract Symptoms (LUTS) after Transurethral Resection of the Prostate (TURP) occur in one-third of Benign Prostatic Hyperplasia (BPH) patients, may be caused by persistent prostatic inflammation and fibrosis.
Objective:
This study aims to evaluate the role of inflammation and fibrosis in pathological mechanism of LUTS among patients with BPH who underwent TURP by assessing their PSA, TNF-α, and TGF-β level.
Design, Setting, and Participant:
Data in this study were analyzed with the 2-way hypothesis. The study used odds ratio to define the risk factors of LUTS after TURP. The samples of the study are BPH patients after TURP aged 50-80 years old.
Interventions:
No intervention(s).
Outcome Measurements and Statistical Analysis:
The data analyzed using SPSS version 21.0 for Windows.
Results and Limitations:
There were 34 cases of LUTS and 42 controls without LUTS. We found that there were increased levels of TNF-α (> 46.95 pg/ml) (OR 55.6, 95% Confidence Interval [CI] 11.1-278.4, p=0.00) and TGF-β (> 207.63 pg/ml) (OR 16.7, 95%CI 5.3-52.8, p=0.00). The result of multiple linear logistic regression analysis obtained equation Y= 0.033 x TNF-α + 0.031 x TGF-β. Population Attributable Risk (PAR) % TNF-α is 60%, PAR % TGF-β is 53%.
Conclusion:
Combination of elevated levels of TNF-α (>46.95 pg/ml) and TGF-β (>207.63) in prostate tissue is the risk factors for the occurrence of LUTS after TURP.
Patient Summary:
In this study, we enrolled 76 patients who were diagnosed with BPH and urinary retention. After TURP, there were 34 cases of LUTS and 42 controls without LUTS. We found that the levels of TNF-α and TGF-β between cases and controls were significantly different. We conclude that the combination of elevated levels of TNF-α and TGF-β in prostate tissue is the risk factors for the occurrence of LUTS after TURP.
1. INTRODUCTION
Benign Prostatic Hyperplasia (BPH) is one of the most common degenerative diseases among older men, which is diagnosed based on histological examination. Nowadays, the gold standard of surgical therapy for BPH is Transurethral Resection of the Prostate (TURP), however, not all of the patients can completely recover from Lower Urinary Tract Symptoms (LUTS) after getting resected. To date, the risk factors of getting LUTS after TURP are still unknown.
LUTS is classified as obstructive, irritative, and after micturia. LUTS covers about 90% of men aged 45 to 80 years old [1, 2]. Since 1992, the grading of LUTS is assessed by the International Prostate Symptom Score (IPSS) [3-5]. LUTS is not a life-threatening condition but can significantly reduce the quality of life of the patients [6].
Gold standard management for BPH with retention is TURP. However, 33-35% of BPH patient with retention tends to suffer LUTS after TURP, mainly within 2-6 weeks after operation3. Few studies have concluded that BPH with inflammation can cause persistent LUTS symptoms. To date, there is no clear explanation on the role of inflammation and fibrosis at LUTS after TURP [6, 7].
Prostate Specific Antigen (PSA) is a glycoprotein produced in epithelial cells which is stacked in the ducts of prostatic gland. The elevation of PSA level is the important marker of some prostate diseases such as BPH, acute and chronic prostatitis, and prostate cancer [8-12]. Patient with inflammation and high PSA level often suffers from LUTS after TURP, that eventually can reduce the quality of life of the patient after surgery [13, 14].
TNF-α is a pro-inflammatory cytokine produced by macrophage and T cell, thus promotes IL-6 (produced from the stromal cell and epithelial cell), and induces epithelial cell proliferation [15-18]. Moreover, TNF-α likely induces TGF-β and causes epithelial-mesenchymal transition process [19-21].
Aging and chronic inflammation generate the growth factor and cytokine, elevating the synthesis of collagen. TGF-β is produced by the cells of granulation tissue, which generates migration and proliferation of fibroblasts, enhances collagen synthesis and fibronectin, and also reduces Extra Cellular Matrix (ECM) degradation which induces fibrogenesis. Prostatic fibrosis triggers a more rigid tissue architecture, thus it gives adverse effects on the function of urethra [22-24]. Ma and Descadeud found that fibrosis is one of the processes that occurs in the prostate and associates with LUTS [25, 26].
The fact about the role of inflammation and fibrosis in LUTS among patients with BPH after TURP now becomes one of the most interesting studies in the medical field. Therefore, it would be such a worthwhile contribution to study the risk factors of LUTS after TURP by evaluating PSA, TNF-α, and TGF-β levels. This study aimed to evaluate the role of inflammation and fibrosis in pathological mechanism of LUTS among patients with BPH who underwent TURP by assessing their PSA, TNF-α, and TGF-β levels.
2. METHODS
This nested case-control study aimed to assess the role of risk factors in influencing the disease (cause-effect relationship). The samples of the study were BPH patients after TURP, aged 50-80 years old. The case group consisted of subjects presented with LUTS after TURP (IPSS 8-35), and the control group consisted of subjects with no LUTS (IPSS 0-7). The independent variables were PSA (with a known cut-off point), TNF-α and TGF-β in prostate tissue (cut off point is calculated through ROC formula) and the dependent variables (LUTS after TURP) were analyzed with the 2-way hypothesis. The study used the odds ratio to define risk factors of LUTS after TURP. The tabulated data was then analyzed using SPSS version 21.0 for Windows.
Several hospitals in Denpasar, Bali, were used for diagnosing, TURP therapy, and assessment of IPSS after TURP. Histopathology examination of the prostate and bladder tissue examination, PSA test examination, TNF-α and TGF-β levels in prostate tissue was examined at a certified laboratory in Denpasar. The study was conducted from May until November 2016. Thirty-four cases and forty-two controls were enrolled. Ethical Certificate was approved by Ethical Committee Medical Faculty Udayana University/Sanglah General Hospital No: 1557/UN.14.2/Litbang 2016
3. RESULTS
Description of the differences in PSA levels, PSA density, TNF-α, and TGF-β levels is also shown by the following boxplot graphic (Fig. 1A-D), (Table 1).
| Parameter | Case N = 34 Mean ± SB or Mean Rank* |
Control N= 42 Mean ± SB or Mean Rank* |
t-test Mann-Whitney U* (p) |
|---|---|---|---|
| Age (year) | 64.6 ± 8.9 | 63.9 ± 7.8 | 0.3 |
| Body Mass Index* (kg/m2) | 34.47 | 41.76 | 0.152 |
| Pre-op Prostate volume (gr) After op Prostate volume (gr) |
42.9 ± 15.2 13.00 + 7.59 |
48.1 ± 18.2 11.31+4.39 |
0.123 0.347 |
| Bladder volume (mL) Cholesterol* (mg/dL) Triglycerides* (mg/dL) Testosterone (ng/dL) |
438.7 ± 34.8 37.5 39.1 405.3 ± 189.7 |
438.6 ± 32.4 39.3 38.1 433.4 ±166.9 |
0.428 0.722 0.843 0.55 |
| Prostate Inflammation* Bladder Inflammation* |
38.72 42.79 |
38.32 35.02 |
0.933 0.073 |

The PSA and PSA density variables did not correlate with IPSS values (p=0.415 and 0.656, respectively), while TNF-α and TGF-β had significant correlations with IPSS (p=0.00). There was a significant correlation between TNF-α and TGF-β with a correlation coefficient of 0.607 (p=0.00).
Thus, the feasible variables to be followed by regression test were TNF-α and TGF-β. The main requirement of linear regression is the absence of multicollinearity between independent variables, in this case, TNF-α and TGF-β.
In Table 2, VIF values were obtained between 0.1-10. This means that there was no multicollinearity. The determinant coefficient (R2) showed a good result of 0.934, it showed that both independent variables (TNF-α and TGF-β) play a dependent variable (IPSS) of 93.4%. The result of the constant is not significant (0.945), it must be removed from the calculation to obtain the following equation:
Y= (0.033 x X1) + (0.031 x X2); Y= IPSS; X1= TNF-α; X2= TGF-β
IPSS= (0.033 x TNF-α) + (0.031 x TGF-β)
| Variable | VIF | Unstandardized coefficient | R2 | p |
|---|---|---|---|---|
| TNFα | 7.764 | 0.033 | 0.934 | 0.019 |
| TGFβ | 7.764 | 0.031 | – | 0.00 |
If the TNF-α value is constant, then the TGF-β value will rise by 0.031 and if the TGF-β value is constant, the TNF-α value will rise by 0.033. Thus, the values of TNF-α and TGF-β can be used to predict the value of IPSS, as well as the occurrence of LUTS after TURP.
The variables of PSA and PSA density were known to have the cutoff value 4 pg/mg and 0.15 pg/mg, respectively. There was no cut off value of TNF-α and TGF-β tissue levels in BPH patients, so it is necessary to assess the best intersection point from TNF-αand TGF-β tissue as the risk factors of LUTS after TURP in BPH patients. The best intersection point of TNF-α tissue based on sensitivity and specificity test was 46.945 pg/mg with 73.5% sensitivity and 95.2% specificity with ROC area:0.882 (95% CI:0.800-0.964; p=0.000) as shown in Fig. (2A). Furthermore, TNF-α tissue grouping is said to be at high level if the value is > 46.945, and at low level when it is ≤ 46.945.
The best intersection point from TGF-β tissue based on the sensitivity and specificity test was 207.63 pg/ml with 73.5% sensitivity and 85.7% specificity with ROC area: 0.86 (95% CI: 0.766-0.953; p=0.000), as shown in Fig. (2B). For subsequent TGF-β tissue, grouping is said to be at a high level if the value is >207.63 and at a low level when it is ≤ 207.63.
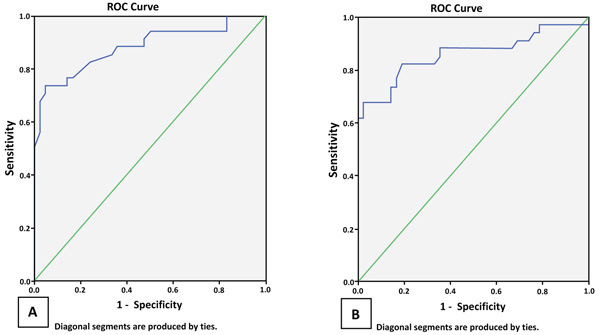
Table 3 shows significant ORs on TNF-α and TGF-β, this data supports that TNF-α and TGF-β are risk factors LUTS after TURP in BPH patients.
| Variable | Odds Ratio | CI 95% | p |
|---|---|---|---|
| PSA | 0.680 | 0.273-1.693 | 0.407 |
| PSA density | 1.006 | 0.397-2.551 | 0.99 |
| TNF-α | 55.556 | 11.087-278.379 | 0.000 |
| TGF-β | 16.667 | 5.266-52.750 | 0.000 |
4. DISCUSSION
This study showed no significant differences in PSA levels between the 2 groups and no significant correlation between PSA and LUTS levels. It means that there was no evidence of PSA role in LUTS. Odds Ratio value was 0.680 (95% CI: 0.273-1.693, p=0.407).
The mean PSA density between 2 groups showed there is no significant difference and no significant correlation found between PSA density expressions with LUTS. This study also showed that there is no evidence about the role of PSA density in LUTS after TURP. With a cut off of 0.15pg/ml, the OR obtained was 0.680 (CI 95%:0.273-1.693, p=0.407), so that the presence of PSA density cannot be considered as a risk factor nor protective factor for LUTS after TURP.
The role of PSA in the blood as a risk factor was not supported by research conducted by Cantiello, Guizhong, and Park [27-29]. Cantiello stated there were no significant differences in the levels of PSA in the blood specimen inflammatory compared with no inflammation (p=0.68) [27]. Research by Lim showed a weak correlation between levels of PSA in the blood with r=0.1375 (p=0.0003), however, with the coefficient of determination (R2) 0.0189, it could explain the influence of PSA in the blood at 1.89%. Park, 2013, showed a positive correlation between PSA with IPSS (adjusted by age), but it has no predictive value [28-30].
The benefits of this study compared with a wide range of studies that have been performed were the use of a control group of non-LUTS patients. There was no correlation found between PSA levels and IPSS. It means that PSA is not a risk factor for LUTS after TURP. There were many other factors that could contribute to the occurrence of elevated PSA on BPH; duration of urinary retention, catheter insertion, Digital Rectal Examination (DRE), after intercourse, and infection of the prostate. On the other hand, chronic inflammation in the prostate gland was not only caused by PSA (self-antigens) solely. Other conditions also give the effect of inflammation of the prostate such as androgen hormones, diabetes, uric acid blood, obesity, and others. Future prospective control study is needed to prove the interaction between PSA and LUTS after TURP by controlling various confounding factors.
The expression of TNF-α in prostate tissue on the case group compared to the control group showed a significant difference, it means that there is a role of TNF-α in prostate tissue on LUTS after TURP. The higher the expression of TNF-α in prostate tissue, the higher the IPSS score. Coefficient correlation of 65.9% means moderate correlation. This correlation can explain that numerous inflammatory cytokines also have the role in LUTS after TURP. Few studies about tissue TNF-α expression using ELISA is available so that no literature mentioned the cutoff point for the expression of TNF-α. With ROC method, we calculated the cutoff value i.e. 46.945, with sensitivity 73.5% and specificity 95.2%, wide area ROC:0.882 (95% CI: 0.800–0.964; p=0000) then the Odds Ratio is calculated using a cut off value of 46.945. The value of Odd Ratio is 55.556 (CI 95%: 10.834-278.379, p=0.00). TNF-α expression in prostate tissue was found more than 46.945 in BPH patients, which has 55.556 times chance to cause LUTS after TURP compared with the value of TNF-α tissue expression less than 46.945.
Some relevant studies have been reported by Shenk and Nadler [31, 32]. Shenk conducted research using nested case-control with BPH group of the case (with high IPSS score) of 727 people and non-BPH control group (with low IPSS score) of 727 people, examined various marker including TNF-α serum expression, to determine risk factors for the occurrence of BPH. Nonparametric comparison test with median and geometric mean ratio between case and control group was not significantly different (p=0.67 and 0.65 respectively). Similarly, Odds Ratio of TNF-α serum expression showed varying results depending on 3 adjusted models used, but all showed an Odds Ratio number that exceeded the number “1”, indicating that serum TNF-α did not contribute as a risk factor for BPH (with elevated IPSS score) (p = 0.73 0.88 and 0.51) [31].
Our study attempts to improve the design of Shenk by analyzing the expression of TNF-α in prostate tissue as a risk factor [31]. The results obtained in accordance with the expected expression of TNF-α in prostate tissue as a risk factor of persisting LUTS after TURP in patients with BPH.
Research by Nadler compares TNF-α expression in prostate’s fluid (Expressed Prostatic Secretion (EPS)) in healthy people, patients with prostatitis with inflammation and patients with BPH were 15%, 100%; and 17%. EPS was performed using prostate massage by Digital Rectal Examination (DRE) [32]. Nadler's results are in line with our results, with the focus of TNF-α expression in the prostate fluid in the prostatitis group with inflammation, being higher than BPH. Differences in sampling techniques do not affect interpretation because they are representative of TNF-α expression in the prostate.
There are a significant difference and correlation of TGF-β in the prostate tissue between two groups. It showed that there is a role of TGF-β for LUTS after TURP. Higher TGF-β in BPH tissue has a higher IPSS score. The moderate correlation coefficient of 67.5% can be explained as the fibrotic process that also has a role in LUTS after TURP. There is no published research on TGF-β in prostate tissue before. We used ROC method to get cut off point of TGF-β in prostate tissue. The score 207.63 were obtained, with 73.5% sensitivity and 85.7% specificity with ROC area: 0.86 (95% CI: 0.766-0.953; p=0.000). Chi-square correlation test of TGF-β in prostate tissue and LUTS after TURP showed a significant result (p=0.00). This study was designed to prove that the expression of TGF-β in prostate tissue as a risk factor of LUTS after TURP, then the Odds Ratio is evaluated using cutoff value of 207.63. The value of Odds Ratio is 16.667 (95% CI: 11.087-278.379, p=0.00), which means that in a patient with TGF-β expression in prostate tissue greater than 207.63, he/she will have a possibility of LUTS after TURP 16.667 times compared to whose TGF-β less than 207.63.
The findings of this research are supported by various studies that have been conducted with varying designs. Cantiello proved the histological evaluation of higher collagen quantities in the prostate inflammatory group, while elastin was lower in the control group, although not statistically significant [27]. In addition, there was a positive correlation between IPSS with collagen quantity (r=0.649; p<0,001), and negative correlation between IPSS with elastin (r=0.56; p=0,001).
The role of fibrosis in LUTS was also described by Ma, in a study of periurethral prostate tissue which demonstrated nonlinear viscoelastic mechanical behavior [25]. Prostate tissue samples from patients with LUTS have varying degrees of stiffness (p=0.0016) and higher collagen (p=0.0038) deposits than those patients without LUTS. This reinforces the pathogenic roles of extracellular deposit matrix and periurethral prostatic tissue fibrosis in the development of LUTS.
The role of TGF-β in LUTS is proved by Kermani with a focus on conversion of myofibroblasts and ECM deposits that play a role in prostate tissue fibrosis [33]. The results of this study indicate that prostatic stromal fibroblasts can be induced by exogenous TGF-β to express collagen 1 and 3, vimentin, calponin, and tenascin proteins and myofibroblast phenoconversion. It is shown that TGF-β plays an important role as a mediator of myofibroblast phenoconversion and can promote fibrotic changes in prostate tissue architecture associated with the occurrence of LUTS.
This study explores the linkages between TNF-α and TGF-β in prostate tissue. Spearman correlation test showed a significant correlation with correlation coefficient r=0.607 (p= 0.00). Logistic regression analysis and determinant coefficient (R2) demonstrated a statistically significant relationship that is 0.93, between the variables (TNF-α and TGF-β in prostate tissue) and the dependent variable (IPSS after TURP) (R2 = 93.4%). The equation is Y= (0.033 x TNF-α) + (0.031 x TGF-β). Thus, both TNF-α and TGF-β are not only risk factors for the development of LUTS but can be used also to predict LUTS after TURP.
This study produced a new finding that reinforces the concept of LUTS after TURP pathogenesis through the role of two important conditions of inflammation and fibrosis. The concept is evidenced by the expression of TNF-α and TGF-β in prostate tissue as a risk factor of LUTS after TURP. The TGF-β as fibrosis representative has a central role in the persistence of LUTS after TURP, while TNF-α as an inflammation representative can be either through direct or indirect inflammation path through fibrosis.
Hence, the TNF-α and TGF-β in prostate tissue could reinforce the inflammatory and fibrosis processes containing opportunities for potential intervention in both processes as an effort to minimize the possibility of persistent LUTS after TURP.
CONCLUSION
TNF-α and TGF-β could be used as the risk factors and predictors for LUTS after TURP due to the contribution of inflammatory and fibrosis processes. Further study about potential intervention in both processes is required to minimize the possibility of persistent LUTS after TURP.
ETHICS APPROVAL AND CONSENT TO PARTICIPATE
This study was approved by Ethical Committee Medical Faculty Udayana University/Sanglah General Hospital No: 1557/UN.14.2/Litbang 2016.
HUMAN AND ANIMAL RIGHTS
No Animals were used in this research. All human research procedures followed were in accordance with the ethical standards of the committee responsible for human experimentation (institutional and national), and with the Helsinki Declaration of 1975, as revised in 2013.
INFORMED CONSENT
Informed verbal consent from each study participant was obtained.
CONFLICT OF INTEREST
The authors declare no conflict of interest, financial or otherwise.
ACKNOWLEDGEMENTS
Declared none.

