All published articles of this journal are available on ScienceDirect.

New Insights into the Pathogenesis of Intradialytic Hypertension
Authors Info & Affiliations
Abstract
Background:
Intradialytic hypertension is identified as an independent predictor of adverse clinical outcome in hemodialysis patients. Little is known about its pathophysiological mechanism.
Objective:
The aim of this study is to provide new insights into the mechanisms underlying this arterial pressure dysregulation.
Methods:
62 subjects on chronic hemodialysis were included in this study. Blood pressure was monitored before, during and following each dialysis session for a 3-month period. Pre- and post-dialysis blood samples were drawn from all the subjects to perform immunoassays, monocyte extractions and western blot analyses.
Results:
Blood pressure values separated the subjects with in two groups: normal blood pressure (n=53) and intradialytic hypertension (n=9) groups. Renin, angiotensin converting enzyme I and aldosterone plasma concentrations significantly diverged between the groups. Vascular endothelial nitric oxide assessment revealed significantly lower plasma L-citrulline and angiotensin-converting enzyme II in post-dialysis intradialytic hypertensive patients, along with high endothelin I and asymmetric dimethylarginine concentrations. Plasma collectrin levels were significantly higher in pre and post-dialysis intradialytic hypertensive group compared to a normal blood pressure group. Post-dialysis interleukin 6 was significantly higher in intradialytic hypertensive group compared to normal blood pressure group. Finally, pre-dialysis intradialytic hypertension was associated with significantly higher circulating vascular endothelial growth factor C with monocytic up-regulation of vascular endothelial growth factor C/tonicity-responsive enhancer binding protein expression.
Conclusion:
Impairment of vascular endothelial nitric oxide key regulatory elements, as well as monocytic vascular endothelial growth factor C seems to be more prevalent in intradialytic hypertension. These clues could pinpoint novel therapeutic interventions in intradialytic hypertension management.
1. INTRODUCTION
Chronic Kidney Disease (CKD) is becoming more prevalent and is currently affecting 13% of the United States population [1]. It portends serious hazards on human health [2, 3] and is a major cause of mortality and morbidity [4]. The most common causes of CKD are diabetes mellitus and hypertension [5]. Hemodialysis (HD) is the main treatment modality in end stage renal disease. Ensuring blood pressure stability before, during and following an HD session is a key factor for intradialytic hemodynamic status, and intradialytic hypotension is a major side effect of dialysis with an estimated prevalence of 20-50%, mostly related to excessive ultrafiltration [6]. However, despite ultrafiltration and anti-hypertensive medication, 15% of HD patients show an increase in post-dialysis blood pressure, known as “Intradialytic Hypertension” (IH) [7, 8]. IH is classically defined as a 10-mmHg increase of systolic blood pressure (SBP) at the end of the HD session [9]. There is mounting evidence to consider IH as an independent predictor of adverse clinical outcomes such as non-access-related hospitalization, cardiovascular complications and six-month mortality [9, 10]. IH genesis is poorly recognized and its significance controversial, incriminating volume overload and sodium uptake [11, 12], sympathetic overactivity [13], Renin Angiotensin Aldosterone System (RAAS) activation [14], endothelial dysfunction [15] and inflammation [9, 16, 17]. However, it is still unclear whether these factors are considered as causes or consequences of IH. Hence, there is a need to assess further different biomarkers in order to clarify their pathophysiological role in IH.
The objective of the current study is to assess the occurrence of IH in CKD subjects under HD, and to simultaneously characterize kinetics of endothelial environment molecules potentially implicated in its pathogenesis, namely circulating levels of nitric oxide (NO) synthesis regulators, vascular endothelial growth factor C (VEGF-C), angiotensin converting enzyme II (ACE II), sympathetic activity, and the activity of VEGF-C/tonicity-responsive binding-protein (TonEBP) salt homeostasis regulators [18].
2. MATERIALS AND METHODS
2.1. Study Population
All the CKD-5D patients on chronic HD at a tertiary university hospital (Hotel Dieu de France, Beirut) were eligible for the study. The inclusion criteria were: patients aged 18 to 80 years, on HD for more than six months and deemed by their primary nephrologist as able to provide informed consent. Patients with ongoing infection, pulmonary diseases, inflammatory disease, congestive heart failure, cancer, or any other terminal disease were excluded from the study. The protocol was approved by the Ethical Committee of the Saint Joseph University and the Hotel Dieu de France University Hospital (Beirut) according to the declaration of Helsinki.
Of the 80 patients initially eligible for the study, 62 subjects were enrolled following inclusion/exclusion criteria. All the subjects underwent three HD sessions per week with a minimal duration of four hours/session. The dialyzer used was “Renak” 1.5 to 1.8 m2. HD was performed in the regular setting in a quiet room. Adequacy of dialysis was assessed using KT/V.
2.2. Study Procedure
The study was conducted over three months, with 36 HD sessions per patient. Modality of HD was kept stable during the whole study period. Dialysate sodium concentration was the same for all the patients, with a linear decrease over the session starting from 142meq/l and ending at 138meq/l. Body weight, temperature and heart rate were measured before and after each HD session. Blood pressure was monitored using an automated sphygmomanometer integrated into the dialysis B Braun machine, before, hourly during and immediately following the dialysis session. Pre-dialysis blood pressure was measured in the non-access arm at the beginning of HD after 10-minutes rest with the patient seated in the dialysis chair before placement of a dialysis needle. Post-dialysis blood pressure was measured at the end of the session, 10-minutes after disconnecting the patient from the dialysis circuit. A subject was considered to have IH when the post-dialysis SBP increased by ≥ 10mmHg compared to his pre-dialysis value in at least 30 of 36 HD sessions.
Routine laboratory results and concurrent dialysis prescription were retrieved. Past medical history and medications updates were also obtained.
2.3. Blood Sampling and Plasma Preparation
Blood samples were drawn from all the subjects before and following each HD session in EDTA tubes. Whole blood was centrifuged, and plasma was collected and stored at -80°C for plasma biochemical assays.
2.4. Isolation of Human Peripheral Blood Mononuclear Cells
Peripheral blood mononuclear cells were isolated from fresh whole blood on a Ficoll-Paque Plus (GE Healthcare Bio-Sciences, Uppsala, Sweden) gradient, according to the manufacturer’s instructions. The isolated monocytes were then mixed with a modified RIPA lysis buffer kept on ice. Finally, protein samples were stored at -80°C.
2.5. Plasma Biochemical Assays
Human plasma concentration of the different molecules studied were measured using ELISA technique for NBP and IH groups. Kits were provided as follow: Tumor necrosis factor alpha (TNF-α) (DTAOOC), VEGF-C (DVEC00), Endothelin-1 (ET-1) (DET100), angiotensin-converting enzyme I (ACE I) (DACE00), renin (DREN00) and aldosterone (KGE016) from R&D system Inc. Minneapolis, MN, USA; Asymmetric dimethylarginine (ADMA) (K7860) and L-citrulline (K6600) from Immunodiagnostik AG, Bensheim, Germany; ACE II (IB39494) from Immuno-Biological Laboratories, Inc. Minneapolis, MN, USA; collectrin (CSB-EL023823HU) from Cusabio Biotech CO., LTD, Wuhan, Hubei, China; C-reactive protein (CRP) (ab181416) and interleukin 6 (IL-6) (ab178013) from Abcam, Cambridge, UK.
2.6. Western Blot
Protein concentration was determined using the Bradford protein assay (Bio- Rad, Marnes-la-Coquette, France). Proteins were separated by SDS 10% PAGE then blotted on polyvinylidene fluoride membranes (Bio-Rad Laboratories Inc., Irvine, CA, USA). The blots were probed with antibodies against: VEGF-C [19] (1:500; rabbit polyclonal to VEGF-C; Abcam ab9546, Cambridge, UK), TonEBP [20] (1:1000; rabbit polyclonal to TonEBP; Abcam ab3446, Cambridge, UK), GAPDH [21] (Glyceraldehyde 3-phosphate dehydrogenase, reference protein) (1:2500; rabbit polyclonal to GAPDH; Abcam ab9485, Cambridge, UK). Following incubation with Clarity Western ECL chemiluminescent substrate (Bio-Rad Laboratories Inc., Irvine, CA, USA), chemiluminescent signals were visualized and developed on Kodak films. Quantifications were finally performed using the ImageJ software. Three western blots were performed for each protein and for every patient in the IH group and for nine random patients in the NBP group.
2.7. Statistical Methods
Statistical analysis was performed with the Sigma Plot exact graphs and data analysis version 12.5 for Windows. When two conditions were compared, two-tailed Student’s t-tests were used when normal distribution with equal variances was met as verified by the Shapiro-Wilk test.
Categorical data were reported as percentages. Shapiro-wilk and Kolmogorov-Smirnov tests were used to assess significant departure of continuous variables from normality. For variables with non-gaussian distribution, the median with its interquartile range was used. For variables not departing significantly from normality, mean ± standard deviation was reported.
A repeated-measure Multivariable Analysis Of Variance Model (MANOVA) was used to assess the variation of the dependent variables (DVs) (plasmatic levels of the different markers, and clinical parameters: SBP, heart rate, temperature), with one within factor (time defined as either pre or post-dialysis), and one between factor (group, IH or normal pressure group). The interaction group*time was prespecified in the model. Univariate F tests were then conducted for individual DVs at the 5% level. Due to the non-random design and the unbalanced group sizes, type III sum of squares was used. MANOVA was performed using SPSS v22 (IBM Corp. Released 2013. IBM SPSS Statistics for Windows, Version 22.0. Armonk, NY: IBM Corp.).
3. RESULTS
3.1. Blood Pressure and Baseline Characteristics
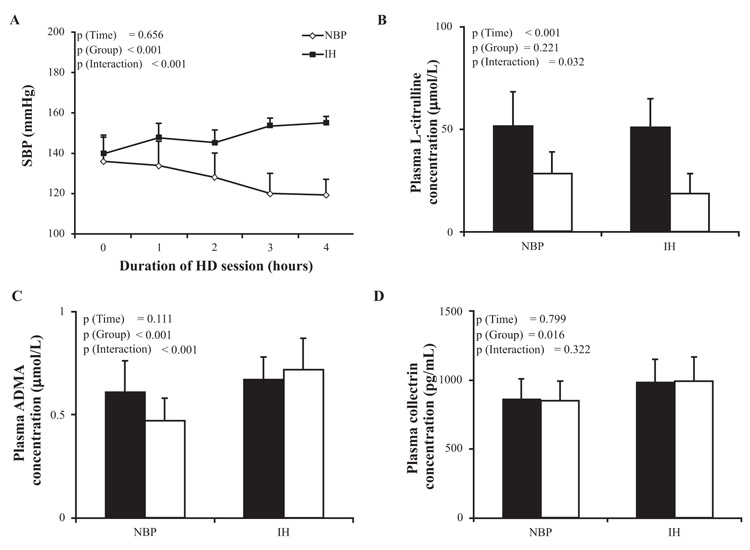
Among the 62 HD subjects included in the study, 37 (60%) were male, median age was 74 (63-80) years, median dialysis duration was 7 [4-10] years and median session duration was 4.5 [4, 5] hours per session (Table 1). The average pre- and post-dialysis SBP values from 36 HD sessions for each patient were analyzed for patient’s grouping. 9 patients had a significant increase in their post-dialysis SBP by ≥ 10 mmHg compared to pre-dialysis value in at least 30 HD sessions, and considered as “IH group” with a prevalence of 15% in our population; 53 patients were considered as “normal blood pressure (NBP) group”, since their post-dialysis SBP did never increase compared to their pre-dialysis value, with a prevalence of 85% in our population. The averages of SBP at pre-dialysis, each hour during HD session and post-dialysis are stated in Fig. (1) A for NBP group (136 ± 12, 134 ± 12, 128 ± 12, 120 ± 10, 119 ± 8 mmHg, respectively), and IH group (140 ± 9, 148 ± 7, 145 ± 6, 153 ± 4, 155 ± 3 mmHg, respectively). The etiologies of end-stage renal disease were roughly comparable between NBP and IH groups, except for polycystic and chronic tubulointerstitial nephritis diseases that were only noted in the NBP group (Table 1).
The average intradialytic variation in SBP calculated as the difference between post- and pre-dialysis was -16.76±8.53 mmHg among NBP and +15.08±5.03 mmHg among IH. Post-dialysis SBP was lower than the pre-dialysis SBP in the NBP group (119±8 mmHg vs 136±12 mmHg respectively), whereas in the IH group, post-dialysis was significantly higher than pre-dialysis SBP (155±3 mmHg vs 140±9 mmHg respectively) (Fig. 1A; p (Group) < 0.001, p (Interaction) < 0.001).
| NBP | IH | p-value | |||
|---|---|---|---|---|---|
| Patient n (%) | 53 (85) | 9 (15) | |||
| Gender n (%) | Men | 32 (60) | 5 (56) | 0.999 | |
| Women | 21 (40) | 4 (44) | |||
| Age (y) | 74[63-80] | 75[61-80] | 0.734 | ||
| Maintenance dialysis duration (y) | 8.05 ± 4.07 | 8.33 ± 3.33 | 0.885 | ||
| Session duration (Hours) | 4.2 [4, 5] | 4.1[4-4.4] | 0.063 | ||
| Antihypertensive medications n (%) | ARB | 14 (26) | 2 (22) | 0.999 | |
| β blockers | 34 (64) | 7 (77) | 0.705 | ||
| CCB | 34 (64) | 9 (100) | 0.464 | ||
| α 1 blockers | 15 (28) | 1 (11) | 0.670 | ||
| α and β blocking agents | 2 (3) | 0 (0) | 0.999 | ||
| Diuretics | 19 (35) | 2 (22) | 0.705 | ||
| Vasodilators | 12 (22) | 0 (0) | 0.185 | ||
| ARB + CCB | 11 (20) | 1 (11) | 0.675 | ||
| Nephropathy causes n (%) | Hypertension | 20 (38) | 3 (33) | 0.999 | |
| Diabetes mellitus | 15 (28) | 1 (11) | 0.425 | ||
| Glomerulonephritis | 7 (13) | 4 (45) | 0.044 | ||
| Polycystic disease | 4 (8) | 0 (0) | 0.999 | ||
| Chronic tubulo-interstitial nephritis | 4 (8) | 0 (0) | 0.999 | ||
| Unknown | 3 (5) | 1 (11) | 0.475 | ||
Patients were on antihypertensive medications, with a higher use of CCB among IH group compared to NBP (100% vs 64%) (Table 1). Timing and dosing of antihypertensive medications were similar between groups, as was the use of non-antihypertensive medications.
3.2. Laboratory Tests
Standard laboratory pre-dialysis measures including hematocrit, hemoglobin, alkaline phosphatase, serum glutamic pyruvic transaminase, parathyroid hormone, serum bicarbonate, serum phosphorus, Serum calcium, urea reduction rate and creatinine reduction rate did not significantly differ between the two groups (Table 2). Kinetics of ACE I plasma concentrations diverged between the NBP and the IH group. The initial difference between the groups diverged significantly due to increases of ACE I levels in the NBP group (p (Time) < 0.001, p (Group) <0.001, p (Interaction) = 0.003). A similar pattern was noted for renin (p (Time) < 0.001, p (Group) < 0.001, p (Interaction) < 0.001) and aldosterone (p (Time) < 0.001, p (Group) < 0.001, p (Interaction) < 0.001) (Table 2). Pre-dialysis Na plasma concentration was similar in both groups as was the post-dialysis Na plasma concentration.
| Variables | NBP | IH | p-value | |
|---|---|---|---|---|
| Hematocrit (%) | 32 ± 4 | 31 ± 2 | 0.292 | |
| Hemoglobin (g/L) | 10.6 ± 1.2 | 10.1 ± 0.7 | 0.250 | |
| Erythropoietin (UI/Kg/week) | 65.68 ± 14.4 | 60.77 ± 8.9 | 0.556 | |
| Alkaline phosphatase (U/L) | 90[76.5 – 123.0] | 141[100 – 218.5] | 0.007 | |
| Serum glutamic pyruvic transaminase (IU/L) | 24 [19-27] | 25[21.5 - 31.5] | 0.403 | |
| Parathyroid hormone (pg/mL) | 179[127 - 275] | 107[71.9 - 188] | 0.078 | |
| Serum bicarbonate (mmol/L) | 22 [20-24] | 24 [22-25] | 0.183 | |
| Serum phosphorus (mmol/L) | 1.47[1.22 - 1.87] | 1.18[0.96 - 1.96] | 0.404 | |
| Serum calcium (mmol/L) | 2.26 ± 0.15 | 2.31 ± 0.19 | 0.448 | |
| Urea reduction ratio | 0.75 ± 0.06 | 0.74 ± 0.05 | 0.851 | |
| Creatinine (μmol/L) | 281 ± 98 | 237 ± 66 | 0.200 | |
| ACE I (ng/mL) | Pre-dialysis | 208.2 ± 36.1 | 162 ± 34.6 | p (Time) < 0.001 p (Group) < 0.001 p (Interaction) = 0.003 |
| Post-dialysis | 260.2 ± 42.4 | 179.3 ± 36.6 | ||
| Renin (pg/mL) | Pre-dialysis | 1070.3 ± 324.8 | 640.4 ± 453.9 | p (Time) < 0.001 p (Group) < 0.001 p (Interaction) < 0.001 |
| Post-dialysis | 1609.9 ± 431.2 | 590.2 ± 406.6 | ||
| Aldosterone (pg/mL) | Pre-dialysis | 371.9 ± 187.2 | 477.8 ± 227.8 | p (Time) < 0.001 p (Group) < 0.001 p (Interaction) < 0.001 |
| Post-dialysis | 1911.3 ± 397.4 | 618.7 ± 197.8 | ||
| Na (mmol/L) | Pre-dialysis | 137 ± 3 | 141 ± 5 | p (Time) < 0.001 p (Group) = 0.635 p (Interaction) = 0.858 |
| Post-dialysis | 144 ± 2 | 144 ± 2 | ||
3.3. Clinical Measurements
In the NBP group, mean interdialytic weight gain and mean intradialytic weight loss were 2.80±0.06 and 2.86±0.25 Kg respectively (Table 3). In the IH group, mean interdialytic weight gain and mean intradialytic weight loss were 1.80±0.15 and 1.95±0.12 Kg respectively (Table 3). Thus, the patients in both groups reached their initial presumed dry weight. To note that dry weight was assessed clinically and reviewed every session by the attending nephrologist. Echocardiography, to assess inferior vena cava diameter, was used in some cases to help in dry weight determination. The body temperature and heart rate remained stable before and after HD sessions (Table 3).
| Parameters | NBP | IH | p-values | |
|---|---|---|---|---|
| Body weight (Kg) | Pre-dialysis | 74.8 ± 17.7 | 70.7 ± 13 | p (Time) < 0.001 p (Group) = 0.573 p (Interaction) = 0.008 |
| Post-dialysis | 71.9 ± 17.2 | 68.7 ± 12.7 | ||
| Mean Intradialytic weight loss (% Intradialytic weight loss) | 3.9 ± 1.0 (2.9 ± 0.9) |
2.8 ± 1 (2.0 ± 0.8) |
||
| Mean Interdialytic weight gain (% Interdialytic weight loss) | 4.0 ± 1.3 (2.8 ± 1.0) |
2.7 ± 1.8 (1.8 ± 1.2) |
0.009 | |
| Mean Body temperature (°C) | Pre-dialysis | 35.9 ± 0.3 | 36.1 ± 0.2 | p (Time) = 0.866 p (Group) = 0.417 p (Interaction) = 0.249 |
| Post-dialysis | 36.1 ± 0.6 | 36.1 ± 0.2 | ||
| Mean Heart rate (beats/min) | Pre-dialysis | 72 ± 9 | 75 ± 8 | p (Time) = 0.128 p (Group) = 0.271 p (Interaction) = 0.926 |
| Post-dialysis | 73 ± 7 | 76 ± 7 | ||
3.4. L-Citrulline, ADMA and Collectrin Plasma Concentrations
Pre-dialysis L-citrulline plasma concentration was similar in both groups. It significantly decreased in post-dialysis in both groups (and post-dialysis L-citrulline plasma concentration was significantly lower in IH group compared to NBP group (p (Time) < 0.001, p (Group) = 0.221, p (Interaction) = 0.032, Fig. 1B).
Pre-dialysis ADMA plasma concentration was comparable between the two groups (Fig. 1C). Post-dialysis ADMA decreased in the NBP group while it increased in IH group (p (Time) = 0.111, p (Group) < 0.001, p (Interaction) < 0.001).
Pre-dialysis collectrin plasma concentrations was higher in the IH group compared to the NBP group and the difference was maintained parallel until post-dialysis (p (Time) = 0.799, p (Group) = 0.016, p (Interaction) = 0.322; Fig. 1D).
3.5. VEGF-C and TonEBP Assessments
The Pre-dialysis VEGF-C plasma concentration was different between the NBP and the IH groups, and the difference was carried out throughout the HD in a parallel course and no significant time*group interaction (p (Time) = 0.082, p (Group) < 0.001, p (Interaction) = 0.122; Fig. 2A). Monocyte VEGF-C protein expression was significantly more pronounced in IH compared to NBP group (Figs. 2B, C). In parallel, monocyte TonEBP protein expression showed similar expression to VEGF-C (Figs. 2B, D).

3.6. ACE II and ET-1 Plasma Concentrations
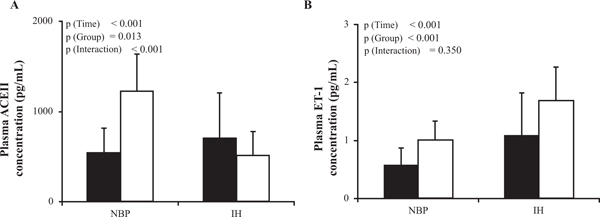
Post-dialysis ACE II plasma concentration significantly differed between pre and post dialysis (p (Time) < 0.001; Fig. 3A), with a significant divergent course between the NBP group where it increased and the IH group in which it decreased (p (Group) = 0.013, p (Interaction) < 0.001), and post-dialysis ACE II plasma concentration was significantly lower in the IH group co. ET-1 plasma concentration increased non differentially in both groups between pre- and post-dialysis; p (Time) < 0.001; Fig. 3B) thus maintaining the pre dialysis between groups difference (p (Group) < 0.001 p (Interaction) = 0.350).
3.7. Inflammation Biomarkers
Pre- and post-dialysis CRP plasma concentrations were comparable in both groups (Table 4), while TNF-α levels increased slightly but significantly between pre and post-dialysis (p (Time) = 0.016) with no difference between the groups (p (Group) = 0.698, p (Interaction) = 0.731). IL-6 plasma concentration increased differentially from pre to post dialysis and was significantly higher in the IH group as compared to the NBP group (p (Time) < 0.001, p (Group) = 0.045p (Interaction) < 0.001, Table 4).
| Inflammatory molecules | NBP | IH | p-values | |
|---|---|---|---|---|
| TNF-α (pg/mL) | Pre-dialysis | 12.9 ± 2.5 | 12.3 ± 2.4 | p (Time) = 0.016 p (Group) = 0.698 p (Interaction) = 0.731 |
| Post-dialysis | 14.4 ± 3.8 | 14.3 ± 3.1 | ||
| CRP (mg/L) | Pre-dialysis | 17.6 ± 7.4 | 21.5 ± 7.1 | p (Time) = 0.241 p (Group) = 0.863 p (Interaction) = 0.731 |
| Post-dialysis | 18.1 ± 8 | 22.2 ± 7 | ||
| IL-6 (pg/mL) | Pre-dialysis | 841 ± 48 | 790 ± 67 | p (Time) < 0.001 p (Group) = 0.045 p (Interaction) < 0.001 |
| Post-dialysis | 870 ± 73 | 986 ± 112 | ||
4. DISCUSSION
The aim of this study is to assess the mechanisms underlying intradialytic hypertension, to identify endothelial and other biomarkers and the substantial cross-talk between the endothelium and macrophages.
In this study, SBP was the main parameter used for dividing the patients into two groups, NBP and IH. Nine of the sixty-two patients showed, as per IH definition, an SBP increase of more than 10mmHg at the end of the HD session, representing 15% of the included sample, in concordance with previous studies [11, 12].
In HD patients, one crucial factor affecting the arterial blood pressure is volemia [22]. Many studies, especially the study of Agarwal and al [12], suggested that IH may be an indicator of hypervolemia. In the current study, all the subjects reached their clinically preset dry weight, thus rendering the possibility of a concealed hypervolemia unlikely with such a close clinical monitoring.
Many studies have suggested stimulation of RAAS as a potential mechanism in IH [23]. During HD session, ultrafiltration leads to intravascular volume reduction that may enhance RAAS activity and thereby induce a sudden rise in systemic vascular resistance and blood pressure [17]. In the current study, post-dialysis renin, ACE I and aldosterone plasma concentrations increased in NBP patients while remaining unaltered in the IH group throughout the HD time. Similar observations were reported by Chou et al. [17, 24] and suggest that RAAS activation may not be the only mechanism inducing IH. In fact, pharmacological RAAS inhibition is not always effective in controlling intradialytic increases in blood pressure [25].
NO is established as a pivotal signaling molecule in the regulation of a large array of physiological events, especially cardiovascular function. NO is generated from L-arginine by endothelial nitric oxide synthase (eNOS) and the main marker for endothelial dysfunction is down-regulated NO bioavailability [26, 27]. In this understanding, we evaluated the endothelial microenvironment by investigating the plasma level of L-citrulline, ET-1, ADMA and collectrin. L-citrulline is an amino acid released in equimolar amounts to NO after L-arginine conversion by eNOS [28]. In the current study, post-dialysis plasma levels of L-citrulline were significantly lower in the IH group compared to the NBP group, suggesting that higher SBP in the IH group could result from an impaired NO/L-citrulline production. Moreover, the eventuality of L-citrulline removal by hemodialysis is unlikely since post-dialysis L-citrulline plasma levels in the NBP group remained significantly higher than those of the IH group.
Another important player in the endothelial dysfunction is ET-1; NO and ET-1 are natural counterparts in the vascular function where the key function of NO is to limit the constrictor capacity of ET-1 [29]. In the current study, pre dialysis ET-1 levels were higher in the IH group and increased further in post dialysis. Similarly, other studies showed higher post-dialysis levels of ET-1 in hypertensive patients [16, 17, 30, 31]. An inappropriate increase in ET-1 combined with a decrease in NO could play an important role in the pathogenesis of IH.
ADMA plays also an important role in endothelial dysfunction. ADMA is an eNOS inhibitor known for its accumulation in CKD-5D [32]. Conflicting data have been reported about the activity of ADMA in HD, with some studies showing its increase [33] others showing its decrease [34] or showing no significant differences [11, 30] in IH patients. In the current study, higher post-dialysis concentration of ADMA was increased in IH group compared to NBP group, corroborating the findings of Engelberger et al. [34]. Increased ADMA levels and an impaired NO/ET-1 balance would lead to a further decrease in NO bioavailability and SBP rise in IH patients.
Besides the aforementioned factors, a novel protein has been recently added to the NO regulators family, namely collectrin, a transmembrane protein of the collecting duct acting as an amino acid transporter [35]. Some experimental studies have suggested that collectrin plays a protective role against hypertension by maintaining NO balance through its role in facilitating the cellular uptake of L-arginine [36]. To the best of our knowledge, no studies on humans have evaluated the plasma levels of collectrin and its relation to hypertension in HD patients. In the current, plasma collectrin levels were measured in humans. Pre and post-dialysis plasma collectrin concentrations were significantly higher in IH group compared to NBP group. Even though the biological role of circulating collectrin is still unclear, these findings suggest that high circulating collectrin in IH patients are compatible with a compensatory response to counteract the lack in NO bioavailability.
Several studies showed the important role of ACE II in hypertension and cardio-renal disease [37, 38]. ACE II is a tissue enzyme and its circulating levels are low or even undetectable under physiological conditions [39]. It is involved in the degradation of Ang II into Ang (1-7) [40]. Ang (1-7) seems to exert a vasodilator effect via binding to the G-protein coupled receptor Mas and inducing NO release via eNOS activation [41, 42]. The current study showed lower levels of ACE II in the IH group compared to the NBP group, which could be incriminated in the decrease of NO release and thus play a role in the IH genesis. Roberts et al showed a decrease in ACE II plasma activity in HD patient compared to CKD, especially in female HD patients [43]. To the best of our knowledge, the current study is the first to describe the variation of ACE II in IH patients.
Summing up the previous alteration in the endothelial microenvironment is compatible with the hypothesis of the rise in SBP observed in IH patients being related to the disrupted NO key substrates, NO/ET-1, ADMA, collectrin and ACE II.
The immune system has been implicated in the pathogenesis of hypertension, but the underlying mechanisms are still not well elucidated [44]. The majority of HD patients have elevated serum levels of inflammatory markers [45]. The increase in the inflammatory response in these patients may occur via decreased clearance of pro-inflammatory cytokines, volume overload, oxidative stress, patient-related mechanisms, as well as factors related to dialysis technique [46]. More specifically, IL-6 has been shown to be induced by HD in peripheral blood mononuclear cells and to be associated with comorbidity in HD patients [47]. In our study, plasma pro-inflammatory markers TNF-α, CRP and IL-6 were measured. IL-6 increased following HD in IH patients as compared to the NBP group, suggesting a higher inflammatory response in the IH group, irrespective of volume overload or dialysis technique which were similar in both groups.
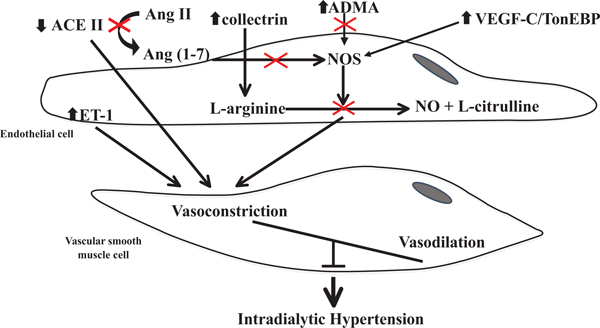
VEGF-C is essential for endothelial cell growth, cell differentiation, angiogenesis and lymphangiogenesis [48, 49]. On endothelial cells, VEGF-C has two main receptors VEGF receptor 2 and 3. In interstitial hypertonicity conditions, VEGF-C is secreted by monocytes, induces endothelial nitric oxide synthase via VEGF receptor 2, which increases NO production and induces vasodilation [50]. In the present study, IH patients had significantly higher circulating VEGF-C and monocytic VEFG-C/TonEBP expression than NBP patients. This increase is compatible with a compensatory response to counteract the NO biosynthesis impairment. In an effort to combine the results and explain their role IH genesis, we elaborated a unifying schema summarizing the explored interactions and pathways (Fig. 4).
CONCLUSION
The current data are compatible with an impairment of vascular endothelial NO key regulatory elements, ADMA, collectrin and ACE II as well as monocytic VEGF-C/TonEBP, all participating in IH pathogenesis. These findings could provide new insights into the pathophysiological scheme leading to the development of IH and could pinpoint for future therapeutic interventions.
AUTHOR's CONTRIBUTIONS
J.H., Y.S., D.C., and N.F., designed the research, performed experiments, analyzed the data and drafted the manuscript. N.J., helped for data analysis and draft the manuscript. G.S., helped for statistical methods. N.K. reviewed the manuscript; D.C., helped for data acquisition. S.A. contribute to the research design.
ETHICS APPROVAL AND CONSENT TO PARTICIPATE
The protocol was approved by the Ethical Committee of the Saint Joseph University and the Hotel Dieu de France University Hospital (Beirut).
HUMAN AND ANIMAL RIGHTS
Animals did not participate in this research. All human research procedures followed were in accordance with the ethical standards of the committee responsible for human experimentation (institutional and national), and with the Helsinki Declaration of 1975, as revised in 2008.
CONSENT FOR PUBLICATION
Informed consent was obtained from all the participants.
CONFLICT OF INTEREST
The authors declare no conflict of interest, financial or otherwise.
ACKNOWLEDGEMENTS
This work was supported by the Research Council of the Saint Joseph University – Faculty of Medicine.

