
Progress in Pediatric Kidney Transplantation
Abstract
Significant progress has been made in pediatric kidney transplantation. Advances in immunosuppression have dramatically decreased rates of acute rejection leading to improved short term graft survival but similar improvements in long term graft survival remain elusive. Changes in allocation policy provide the pediatric population with timely access to transplant but there remains concern about the impact of less HLA matching and a decrease in living donors. This report presents data from North America on these successes and the ongoing challenges that face the pediatric transplant community.
INTRODUCTION
Kidney transplant is the goal of treatment for children with end stage renal disease. There has been significant progress made in the field of kidney transplant including immunosuppressive drug therapy, graft, and patient survival. This progress can be attributed to advances in numerous factors including pre-transplant care, surgical advances, changes in deceased donor allocation policy, and more potent immunosuppressive medications [1]. We present data from North America on these successes and the ongoing challenges that face the pediatric transplant community. Data sources such as the North American Pediatric Renal Trials and Cooperative Studies (NAPRTCS) transplant registry [2] and the Scientific Registry of Transplant Recipients (SRTR) [3] are valuable sources of data that allow trends in graft and patient outcomes in pediatric kidney transplant to be followed. Other registries include the Canadian Organ replacement Registry, the Latin American Pediatric Renal Transplant Cooperative Study and the ERA-EDTA (European Renal Association and European Dialysis and Transplantation Association) Registry.
PATIENT CHARACTERISTICS
Characteristics of pediatric transplant recipients have remained similar over the past decade (Table 1). The most common age at transplant remains 11-17 years (58.8%), followed by 1-5-years (22.9%), 6-10 years (18.27%) and <1 year (0.1%) (2). Males account for approximately 60% of pediatric kidney transplant recipients.. The most common primary diagnosis of end stage renal disease is structural abnormalities (31.8%), focal segmental glomerulosclerosis (FSGS) (12.5%), and glomerulonephritis (10.8%).
Patient characteristics (SRTR Annual data report 2013).
| Level | 2000-2002 | 2010-2012 | |||||||||||
|---|---|---|---|---|---|---|---|---|---|---|---|---|---|
| All | Deceased | Living | All | Deceased | Living | ||||||||
| N | % | N | % | N | % | N | % | N | % | N | % | ||
| Age | <1 | 13 | 0.6 | 0 | 0.0 | 13 | 1.1 | 3 | 0.1 | 2 | 0.1 | 0.1 | |
| 1-5 | 400 | 18.8 | 128 | 14.3 | 272 | 22.1 | 518 | 22.9 | 269 | 19.4 | 249 | 28.6 | |
| 6-10 | 424 | 20.0 | 181 | 20.2 | 243 | 19.8 | 412 | 18.2 | 248 | 17.8 | 164 | 18.8 | |
| 11-17 | 1,286 | 60.6 | 586 | 65.5 | 700 | 57.0 | 1,329 | 58.8 | 871 | 62.7 | 458 | 52.5 | |
| Sex | Female | 866 | 40.8 | 381 | 42.6 | 485 | 39.5 | 907 | 40.1 | 578 | 41.6 | 329 | 37.7 |
| Male | 1,257 | 59.2 | 514 | 57.4 | 743 | 60.5 | 1,355 | 59.9 | 812 | 58.4 | 543 | 62.3 | |
| Race | White | 1,230 | 57.9 | 393 | 43.9 | 837 | 68.2 | 1'110 | 49.1 | 535 | 38.5 | 575 | 65.9 |
| Black | 390 | 18.4 | 241 | 26.9 | 149 | 12.1 | 404 | 17.9 | 325 | 23.4 | 79 | 9.1 | |
| Hispanic | 414 | 19.5 | 214 | 23.9 | 200 | 16.3 | 613 | 27.1 | 449 | 32.3 | 164 | 18.8 | |
| Asian | 65 | 3.1 | 31 | 3.5 | 34 | 2.8 | 96 | 4.2 | 59 | 4.2 | 37 | 4.2 | |
| Other/unk. | 24 | 1.1 | 16 | 1.8 | 8 | 0.7 | 39 | 1.7 | 22 | 1.6 | 17 | 1.9 | |
| Primary cause of disease |
FSGS | 226 | 10.6 | 122 | 13.6 | 104 | 8.5 | 283 | 12.5 | 202 | 14.5 | 81 | 9.3 |
| GN | 389 | 18.3 | 169 | 18.9 | 220 | 17.9 | 244 | 10.8 | 163 | 11.7 | 81 | 9.3 | |
| Structural | 746 | 35.1 | 304 | 34.0 | 442 | 36.0 | 719 | 31.8 | 424 | 30.5 | 295 | 33.8 | |
| Other cause | 762 | 35.9 | 300 | 33.5 | 462 | 37.6 | 1,016 | 44.9 | 601 | 43.2 | 415 | 47.6 |
One demographic characteristic that is changing is the racial distribution of pediatric renal transplant recipients. The proportion of recipients who are Hispanic increased from 19.5% in the 2000-2002 cohort to 27.1% in the 2010-2012 cohort, which is reflective of changes in the general population. The etiology of end stage renal disease varies by ethnicity. FSGS is the leading cause among black transplant recipients, while structural causes (obstructive uropathy, dysplasia) are the most common among white and Hispanic transplant recipients. Awareness of these changes in recipient demographics is important to guide studies of outcomes in emerging populations.
DECEASED DONOR ALLOCATION POLICY
Children are recognized as deserving priority in kidney allocation. Candidates who are listed before their eighteenth birthdays retain their pediatric priority until they are transplanted or removed from the waiting list. A Pediatric Advisory Committee was established by the OPTN in 1993. This group developed a white paper which presented the negative impact of ESRD and dialysis on the growth and development of pediatric patients.
In 2000, the Children’s Health Act was passed by Congress and incorporated as an amendment to National Organ Transplantation Act (NOTA). This Act states that organ allocation policy is to recognize the differences in health and organ transplant issues between children and adults throughout the system, and adopt criteria, policies, and procedures that address the unique health care needs of children. In September 2005, the United Network for Organ Sharing (UNOS) revised kidney allocation policy such that kidney allografts from deceased donors < 35 years were to be offered preferentially to pediatric patients (< 18 years old); Share 35. In June 2012, the Organ Procurement and Transplantation Network approved a new national deceased donor kidney allocation policy that goes into place in December 2014. The major goals of the new allocation policy are to decrease disparities in transplant access and to align expected survival of the allograft with the expected survival of the recipient. This system will allocate the top 20% of kidneys in the kidney donor profile index (KDPI) to candidates in the top 20% of expected post-transplant survival (EPTS) [4].
TRANSPLANT CHARACTERISTICS
The number of pediatric kidney transplants has remained steady between 750 and 800 over the past several years following a peak of 899 in 2005 (Fig. 1). There has been a decline in the proportion of pediatric patients receiving a living donor transplant and an increase in those receiving a deceased donor transplant. Living donor kidney transplants in pediatrics peaked in 2001 at 61% and has subsequently declined to 38% in 2013 [3]. This shift in donor source has also been seen in the adult kidney transplant population. In the pediatric population, there is concern that allocation policy may play a role. Review of data since Share 35 indeed reveals an increase in the number of transplants from deceased donors <35 years among pediatric recipients. However, there was also a significant decrease in the proportion of transplants from living donors; 0.55 pre-Share 35 to 0.35 post-Share 35 [5].
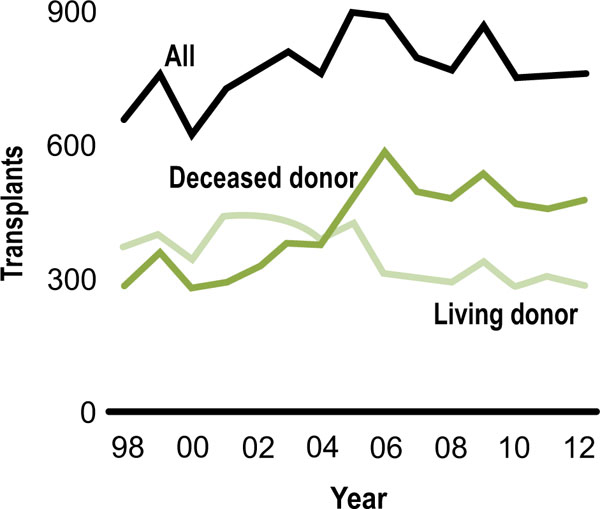
Donor source (SRTR Annual data report 2013).
Looking at the type of living donor, donation from related living donors has decreased over time, while donation from other living donors increased, possibly reflecting an increase awareness and willingness of community members (friends, teachers, church members) to donate (Fig. 2). By age, young recipients are the most likely to receive a living donor transplant The age of deceased donor organs allocated to pediatric transplant recipients has changed over time due to changes in allocation policy and clinical practice patterns (Fig. 3). Since Share 35, there has been an increase in the number of young deceased donor kidney transplants (< 35 yrs) from 62.8 to 133 per quarter (p < 0.001) with a decrease in the number of deceased donors > 35 years old from 22.4 to 2.6 per quarter (p < 0.001) [5]. In addition, the use of young donors has decreased over time with fewer that 10% of deceased donors being younger than 5 years.
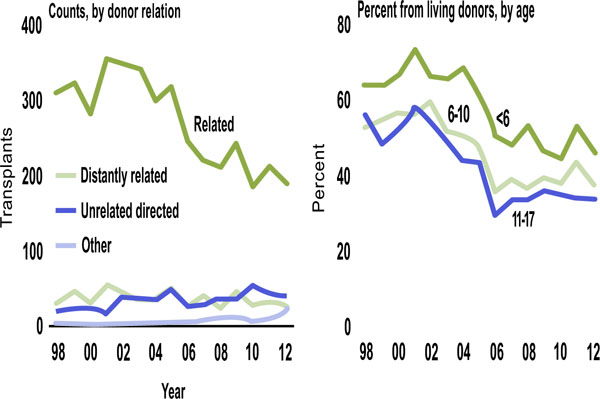
Living donor source (SRTR Annual Data Report, 2013).
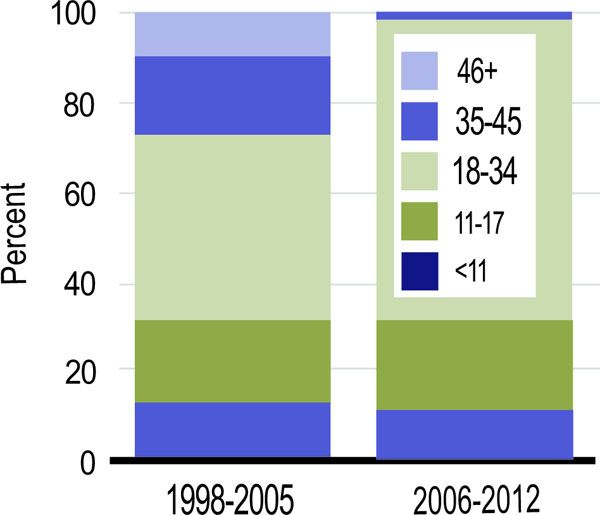
Deceased donor age (SRTR Annual Data Report, 2013).
Interestingly, despite being less common, recent NAPRTCS data revealed that kidneys from donors < 5 years had equivalent patient and graft survival to those from donors > 5years [6]. Compared to the adult population, donation following circulatory death (DCD) kidneys were infrequently used in pediatric kidney transplants recipients (< 5% vs 14.4%) [3]. Extended criteria donor kidneys are rarely used in pediatric recipients with only 1 case reported since 2007.
Over the past 25 years, twenty-four percent of primary transplants in the NAPRTCS transplant registry were preemptive; transplant without history of dialysis [2]. Preemptive transplant occurs more commonly among LD recipients (34%) compared to DD recipients (13%), more commonly in males (28%) than females (20%). The most common age of preemptive transplant recipients is 6-12 years (28%). White transplant recipients are more likely to receive a preemptive transplant (31%) than Hispanic (16%) or black (13%) recipients.
The number of HLA mismatches has increased over time. In 2012, 85% of deceased donor kidney transplant recipients had > 3 HLA mismatches compared to 19.5% of living donor recipients (Fig. 4). Zero-HLA mismatched transplants have been less common after 2005 [7].

HLA mismatches among pediatric kidney transplant recipients (SRTR Annual Data report, 2013).
Over the past decade, between 12-20% of pediatric kidney transplant candidates were waiting for a re-transplant [3]. The challenge of this population is their high level of sensitization and the difficulty finding a suitable donor and the resulting long wait times. Various strategies to address this population have emerged including paired exchange programs and desensitization. In addition, the new kidney allocation policy gives a sliding scale of extra points for the degree of sensitization [4].
GRAFT SURVIVAL
Graft survival among pediatric kidney transplant recipients has improved significantly over the past decade [1] (Fig. 5). Recent analysis of US data demonstrated a dramatic improvement in death censored graft survival over the past 25 years; 1-year graft survival of 97.0% for transplants performed in 2010 compared with 80.9% in 1987, 5-years graft survival of 77.9% for transplants performed in 2006 compared with 59.0% in 1987, and 10-years graft survival of 60.2% for transplants performed in 2001 compared with 46.8% in 1987. The median graft survival improved from 7.2 years for transplants performed in 1987 to 12.3 years for transplants performed in 1998 [7]. The leading cause of graft loss is chronic allograft nephropathy (35.3%) followed by acute rejection (13.2%), thrombosis (9.8%), and recurrence of original disease (7.0%) [2].

Graft survival and rejection over time (1).
PATIENT SURVIVAL
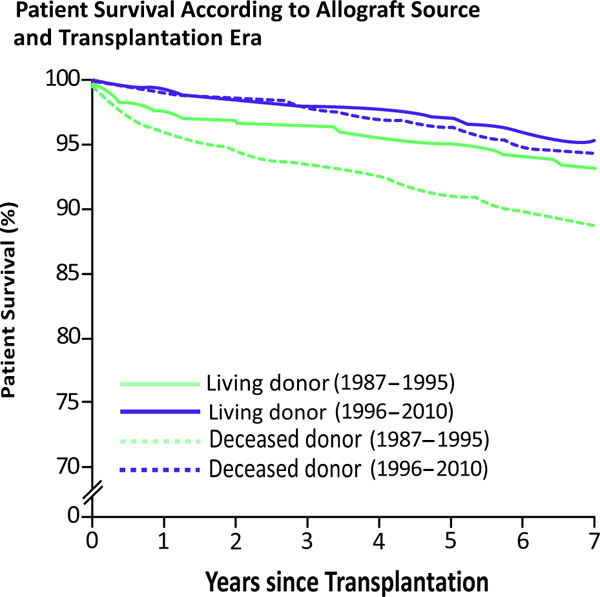
Patient survival rates for living donor recipients were 98.4%, 97.7%, 96.1%, 94.2%, and 92.4% at years 1, 2, 5, 7 and 10 years post-transplant, respectively. Among deceased donor recipients, patient survival rates were 97.4%, 96.5%, 93.3%, 91.1%, and 86.6% at years 1, 2, 5, 7, and 10 years post-transplant. Over the past decade, patient survival has significantly improved for both living donor (LD) and deceased donor (DD) recipients (Fig. 6). The difference between LD and DD survival rates has also decreased.
Graft survival and rejection over time (1).
The causes of death have remained stable over time [2]. The leading cause of death among pediatric kidney transplant recipients is infection (28.5%), followed by cardiopulmonary (14.7%), malignancy (11.3%), and dialysis related complications (3.1%) [1]. Almost half of these patients died with a functioning graft.
IMMUNOsupPRESSION
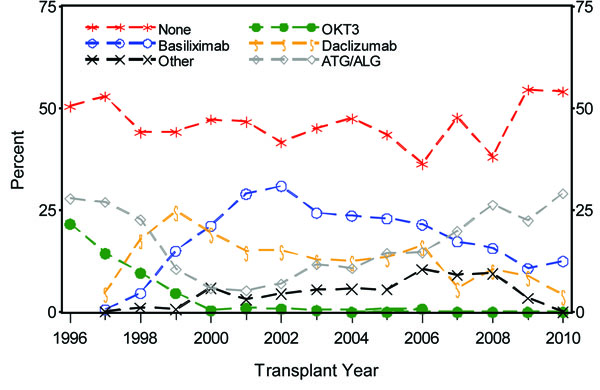
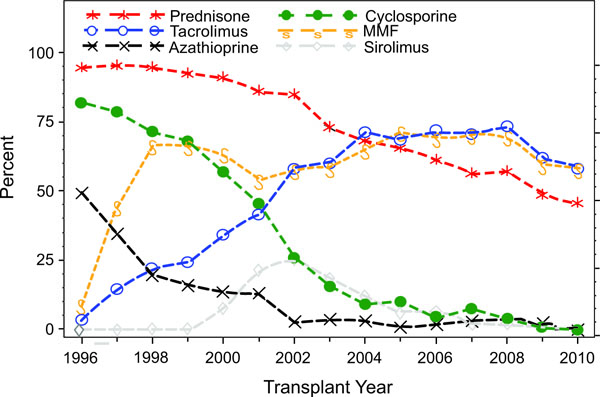
There have been significant changes in the immunosuppressive therapy used in pediatric kidney transplantation which mirror the changes seen in the adult population (Fig. 7a, 7b). Looking at induction medication use in 2009, 54.6% of recipients did not receive induction immunosuppression, the highest level reported since 1996. The most common induction therapy was T cell depleting antibody (22.4%), which has increased in use in the last 3 years. In contrast, use of IL-2 receptor antagonist decreased to 19.5%. Looking at maintenance immunosuppression, the use of cyclosporine has been virtually eliminated with the increased use of tacrolimus from 3.7% in 1996 to 62.1% in 2009. Mycophenolate mofetil (MMF) use increased from 9.0% in 1996 to 59.6% in 2009. Azathioprine use has decreased from 49.3% in 1996 to 2.5% in 2009. Sirolimus was introduced in 1998 with its use peaking in 2002 (25.5%) and subsequently decreasing to only 0.5% in 2009. Steroid avoidance and minimization protocols have become more common with only 48.8% of patients at day 30 receiving steroid treatment in 2009. The most commonly used drug combination for the transplant era 2003-2010 at day 30 post-transplant was tacrolimus, MMF, prednisone in 56% of patients followed by tacrolimus and MMF in 14.8% of patients.
Graft survival and rejection over time (1).
Graft survival and rejection over time (1).
REJECTION
Advances in immunosuppression have led to remarkable decreases in acute rejection rates (Fig. 5). NAPRTCS transplant registry data reveal that the acute rejection rate at 1 year decreased in living donor recipients from 54% in the late 1980s to 8% most recently and among deceased donor recipients; from 69% to 17% [2].
Late acute rejection occurring > 6 month post-transplant has been associated with poor long term graft survival [8]. Delayed graft function and de novo donor specific antibodies have been identified as risk factors.
Age is key determinant of acute rejection risk. The highest risk is in the adolescent recipient (> 12 year old) and the lowest risk is among recipients aged 0-1 years. Analysis of the impact of specific patient and transplant characteristics on the occurrence of first rejection episodes in patients transplanted from 1996 to 2010 demonstrate that among LD recipients, age < 24 months at transplant was associated with a decreased risk of rejection [2].
Among deceased donor recipients, black recipient race was associated with an increased risk of rejection. Delayed graft function (dialysis in the first week post-transplant) was associated with an increased risk of rejection in both living and deceased donor donor transplants.
RENAL FUNCTION
The short-term renal function, measured by estimated glomerular filtration rate (eGFR), has improved in the pediatric kidney transplant population (Fig. 8). The proportions of patients with eGFR > 90 mL/min/1.73 m2 at discharge from transplant hospitalization increased from 17.1% in 2000 to 34.6% in 2012, at 6 months post-transplant from 10.3% in 2000 to 26.3% in 2012, and at 1 year post-transplant from 6.7% in 2000 to 25.9% in 2011 [3]. Among patients transplanted in 2011, 71% and 72% had CKD stage 1-2 at 6 and 12 months post-transplant, respectively. Younger recipients begin with a higher eGFR posttransplant and are subject to greater absolute declines over time compared with older recipients (Fig. 9a, 9b). These differences in function by age at transplant become negligible over time in long-term renal allograft survivors, with the exception of the youngest (0-1 years) recipients who continue to have better function at 7 years post-transplant [2].

Graft survival and rejection over time (1).

Graft survival and rejection over time (1).

Graft survival and rejection over time (1).
GROWTH
Optimizing growth and development is one of the key drivers of timely transplant. Data from the past 2 decades reveal that pediatric patients have significantly improved height Z scores at time of transplant from a mean deficit of 2.43 in 1987 to 1.23 in 2009 [9].
The mean height deficit for patients at the time of transplant was 1.75 standard deviations below the age- and sex-adjusted height level (Fig. 10). This deficit is greater for males (-1.78) than females (-1.70). Younger patients (2-5 years) and re-transplant patients have greater height deficits. Growth hormone post-transplant resulted in a delta Z score of +0.5 standard deviations [9]. Patients < 6 years are the population who demonstrate the most accelerated growth post-transplant. Steroid avoidance protocols have been associated with improved post- transplant growth. Patterns of weight gain post-transplant and the impact of steroid use has been studied in the pediatric population [10]. Analysis of NAPRTCS data revealed an increase in median BMI% of 11.4 units in the first six months post-transplant. BMI% at time of transplant did not impact change in BMI% post-transplant. Steroid free immunosuppression was associated with smaller increases in BMI% than daily steroid based immunosuppression.

Graft survival and rejection over time (1).
VIRAL COMPLICATIONS
The more potent immunosuppressive therapy that has successfully reduced the incidence of acute rejection and improved graft outcomes has also resulted in a higher incidence of viral complications [11]. Infections have now replaced rejection as the leading cause of hospitalization in the pediatric kidney transplant population [12].Significant morbidity, graft loss, and mortality are attributable to viruses such as BKV, Epstein Barr virus (EBV), and cytomegalovirus (CMV). Pediatric kidney transplant recipients represent a unique and and at risk population due to their increased risk for primary infection.
MALIGNANCY
Since the mid-1990s, the incidence of the Epstein Barr virus (EBV)-associated cancer known as post-transplant lymphoproliferative disorder (PTLD) has dramatically increased [1]. In addition, solid tumors have been reported in the pediatric kidney transplant population [13].
CONCLUSION
Significant progress has been made in pediatric kidney transplant outcomes. Advances in immunosuppression have dramatically decreased acute rejection rates and improved short term graft survival, but infectious complications have emerged as a significant source of morbidity and mortality. Changes in allocation policy provide the pediatric population with timely access to transplant, but there remains concern about the impact of less HLA matching and a decrease in living donors. The remaining challenge for the transplant community is to improve long term graft survival by optimizing access to timely transplant while maintaining donor quality and tailoring immunosuppression which minimizes complications.
CONFLICT OF INTEREST
The authors confirm that this article content has no conflict of interest.
ACKNOWLEDGEMENTS
Declared none.

