All published articles of this journal are available on ScienceDirect.

Analysis of Urinary and Plasma Electrolytes in a Rat Model of Unilateral Ureteric Obstruction (UUO)
Authors Info & Affiliations
Abstract
Following unilateral ureteric obstruction (UUO)., hydronephrosis is associated with long term reductions in renal blood flow (RBF) and glomerular filtration rate (GFR)., tubular resistance to arginine-vasopressin (AVP)., and reduced expression of aquaporin water channels and sodium (Na+) and urea transporters. During UUO., renal function is contingent upon adaptive changes in the contralateral kidney. In the short term this response is associated with an increased GFR and a reduced expression of Na+ transporters. We aimed to assess global renal function in UUO., including a comparison between the obstructed and non-obstructed kidneys.
Adult male rats were subjected to UUO of either 3 or 10 days duration. Control rats underwent sham surgery. Before release of the ureteric ligature., blood and both bladder and obstructed renal pelvis urine was sampled., then both kidneys harvested. Urinary and plasma electrolytes and osmolality., and kidney weights., were measured.
We observed i) mild uraemia in the obstructed animals., ii) extreme dilution of urine from the pelvis of the obstructed kidney in the absence of noteworthy alterations in plasma ions., and iii) evidence indicative of a contralateral diuresis/natriuresis.
To the best of our knowledge., this is the first study simultaneously examining such an extensive range of urinary (bladder and obstructed renal pelvis) and plasma markers of renal function in UUO. The results demonstrate that UUO is associated with a small deterioration in overall renal function and marked changes in renal electrolyte handling., leading to changes in the composition of urinary output from both the non-obstructed and obstructed kidneys
INTRODUCTION
UUO is a common and important urological diagnosis. Due to its varied aetiology, to date no reliable cumulative incidence rate is available. Many unilateral obstructions are caused by nephrolithiasis, with calcium oxalate and calcium phosphate stones accounting for 80% of these. The lifetime incidence of nephrolithiasis is 12% in men and 6% in women [1]. Urological intervention secondary to obstruction is necessary when stones exceed 7mm in diameter. 40% of “stone-formers” have hypercalciuria which occurs in response to both genetic and environmental cues [2].
Recovery of renal structure and function following UUO in humans depends on duration, grade and the presence or absence of a superimposed infection. Multivariate analysis
reveals that the pre-operative obstructed kidney GFR is predictive of renal recovery post-relief, with a GFR of 10ml/min/1.73m2 or better associated with improvement or stabilisation of function thereafter [3].
UUO is associated with several physiological adjustments in renal function, both in the affected kidney and on the contralateral side. It is known that both the RBF and GFR can initially rise following obstruction in dogs, before quickly falling again, so much so that RBF reaches approximately 50-75% of normal by 24 hours post-obstruction (in dogs and rats respectively) and GFR is reduced to 20% of pre-obstruction levels after one week of UUO [4-7]. There is a subsequent compensatory increase in the contralateral GFR (rising to 165% of pre-obstruction levels after one week of UUO – discussed in reference [4], although it appears that this is not necessarily the case with the contralateral RBF acutely in either dogs or rats [7-9]. In rabbits with acute UUO, the cortical collecting tubules become resistant to AVP [10]. A reduced ability to respond to the AVP signal leads to reduced abundance of apical aquaporin water channels in UUO in rats [11]. In addition to this, expression of Na+ transporters is also decreased in the obstructed kidney in UUO in rats, as is the case with urea transporters [12, 13]. These molecular changes contribute to post-obstructive diuresis.
While numerous studies in rats and pigs have explored the effects of UUO and its related haemodynamic changes on urinary and plasma osmolality and urea/electrolytes separately, no analysis has yet been performed to concurrently compare and contrast these parameters in the plasma, and in urine extracted from both the obstructed renal pelvis, and the urinary bladder [13-17]. With this in mind, in the first study of its kind, we looked at these indices at both 3 and 10 days post-UUO, and herein we illustrate our findings and discuss the potential mechanisms underlying them.
MATERIALS AND METHODS
Male Wistar rats weighing 200-250g (2 months of age) were reared at The University College Dublin Biomedical Facility. Rats were housed within a temperature/humidity controlled room on a 12 hour light/12 hour dark cycle. Groups of 4 rats were allocated per large cage with free access to food (standard rat chow) and water supplied ad libitum. Rats underwent left-sided UUO and were maintained for 3 and 10 days prior to terminal anaesthesia (5% isoflurane) during which renal tissue (kidney proximal to non-ligated ureter (NL) and kidney proximal to ligated ureter (L)), bladder and obstructed pelvis urine, and blood samples were taken. 20-500uls of urine were extracted from the bladder by needle aspiration; at 3 days, 0.5-1.5mls of urine were aspirated from the renal pelvis, but by 10 days, it was possible to aspirate up to 2mls of urine. Separate animals were used for our 3 and 10 day urine samples i.e., no sampling was performed at 10 days in animals which had been sampled at 3 days. All experiments were ethically approved by University College Dublin, Animal Research Ethics Committee and carried out under a Department of Health and Children license (B100/3611) in accordance with the amended 1876 Cruelty to Animals Act and in accordance with the NIH Guide for Care and Use of Laboratory Animals.
Surgery
Following laparotomy under isoflurane anaesthesia, the left ureter was identified and excess fat removed using small forceps and a cotton bud. The ureter was occluded in two places 2cm distal to the ureteropelvic junction using 5/0 silk ligatures. Sham surgery consisted of a laparotomy on day 0 during which the left ureter was identified, manipulated, and isolated, but not obstructed. These animals were then maintained for 10 days according to the experimental protocol.
Urinary Osmolality
The osmolalities of plasma and urine samples were measured on an ADVANCE (Systems) Micro Osmometer 3300 using depression of freezing point.
Dry and Wet Tissue Weights
The renal tissue was weighed at the time of sacrifice and then dried to completion in an 500(C oven. Relative tissue hydration was calculated as the residual weight in grams derived from subtraction of the dry weight from the initial wet weight.
Urea/Creatinine and Electrolytes (Sodium (Na+), Potassium (K+), Chloride (Cl-))
Urea, creatinine and electrolyte levels were measured on a BECKMAN SYNCHRON LX 20 analyser. The urea levels were analysed using an enzymatic conductivity method, in which non-ionic urea is converted by urease to ammonium and bicarbonate ions, with a corresponding increase in conductance. For creatinine values, a modified Jaffe reaction protocol was used with a primary wavelength of 520nm.
Replication and Statistical Analysis
An n = 5 animals was used for all groups. Results are expressed graphically or in table form as the mean +/- standard deviation and were analysed for significance by unpaired T-test for comparisons of plasma parameters. One-way analysis of variance (ANOVA) with Bonferroni post-hoc testing using SPSS version 12.0.1 for windows (SPSS Inc., USA) was used for analysis of urinary results, given the greater number of inter-group comparisons.
Statistical significance was set at p<0.05. When significance values fell between 0.001 and 0.05, actual value is quoted in result text whereas values less than 0.001 (99.9% confidence limits), results are reported as p<0.001, due to the restricted number of decimal places to which SPSS will report.
RESULTS
UUO Causes Hydronephrosis of the Obstructed Kidney (Fig. 1)
The 3 day L kidney (3d L) had a statistically significant increase in water content vs both the sham kidney and its time matched NL kidney (3d NL) (both p<0.001) (3d L 1.19g +/- 0.15 vs SHAM 0.67g +/- 0.03 vs 3d NL 0.72g +/- 0.022). The very same was true of the 10 day L kidney (10d L) vs sham and its time matched NL kidney (10d NL) (also both p<0.001) (10d L 1.37g +/- 0.14 vs SHAM 0.67g +/- 0.03 vs 10d NL 0.85g +/- 0.057). The water content was also significantly greater in the 10d L kidney vs 3d L kidney (1.37g +/- 0.14 vs 1.19g +/- 0.15, p = 0.049).
UUO Leads to Elevated Plasma Urea and Creatinine Values (Figs. 2,3)
At 3 days post UUO, plasma urea levels had risen significantly from control levels (3d UUO 7mmol/L +/- 0.85 vs SHAM 6mmol/L +/- 0.31, p = 0.028) (Fig. 2). This was even more marked at 10 days post UUO (10d UUO 8.01mmol/L +/ 0.61 vs SHAM 6mmol/L +/- 0.31, p<0.001). Uremia was relatively increased by 10d post-UUO vs 3d (8.01mmol/L +/ 0.61 vs 7mmol/L +/- 0.85 p = 0.03).
A similar picture is noted in creatinine values (3d UUO 40umol/L +/- 3.8 vs SHAM 25umol/L +/- 3.4, p<0.001; and 10d UUO 48umol/L +/- 2.3 vs SHAM 25umol/L +/- 3.4, p<0.001) (Fig. 3). Again, there was a statistically significant difference between 3d UUO and 10d UUO (p = 0.008).
The Uraemia and Elevated Creatinine Levels of UUO are not Associated with Major Alterations in Plasma Electrolyte Values or Osmolality (Table 1)
There was no statistically significant difference between SHAM, 3d UUO, and 10d UUO animals in terms of plasma Na+, potassium (K+), chloride (Cl-), or osmolality.
UUO Results in a Graded Decrease in Urinary Osmolality, Most Marked in the Obstructed Kidney Output (Fig. 4)
At 3 days post-UUO, pooled urine from renal pelvis of ligated left kidneys was of significantly lower osmolality than that of either the matched bladder samples (p = 0.039) or bladder samples from sham operated rats (p<0.001). (SHAM BLADDER (1497mOsm +/- 306) vs 3d UUO BLADDER (951mOsm +/- 528) vs 3d UUO KIDNEY (342mOsm +/- 42) (Fig. 4). At 10 days post-UUO, by which time the renal pelvis of the ligated left kidney was grossly expanded with several milliliters of urine, the pooled urine was of significantly lower osmolality than that of either the matched bladder samples (p = 0.001) or bladder samples from sham operated rats (p<0.001). SHAM BLADDER (1497mOsm +/- 306) vs 10d UUO BLADDER (1084mOsm +/- 236) vs 10d UUO KIDNEY (308mOsm +/- 7.6). Notably, the variation in osmolalities in the pooled urine from the ligated kidney was much less than that seen for cognate, non-ligated derived bladder urine. Bladder urine from UUO animals was of significantly lower osmolality than SHAM BLADDER urine (3d UUO BLADDER 951mOsm +/- 528, 10d UUO BLADDER 1084mOsm +/- 236, SHAM BLADDER 1497mOsm +/- 306) (p<0.001 for both 3d UUO and 10d UUO vs SHAM).
Urinary Na+, Cl-, K+ and Urea Levels in UUO (Fig. 5)
Measured urea levels from the pooled urine of the obstructed kidney were significantly lower than those in sham bladder specimens or samples taken from the bladder of UUO animals, at both 3 and 10 days (SHAM BLADDER 693mmol/L +/- 193 vs 3d UUO KIDNEY 28mmol/L +/- 14.4, p<0.001; 3d UUO KIDNEY 28mmol/L +/- 14.4 vs 3d UUO BLADDER 457mmol/l +/- 284, p = 0.014). At 10 days, a similar observation was noted (SHAM BLADDER 693mmol/L +/- 193 vs 10d UUO KIDNEY 32mmol/l +/- 4.6, p<0.001; 10 d UUO KIDNEY 32mmol/l +/- 4.6 vs 10 d UUO BLADDER 499.8mmol/L +/- 182.5, p = 0.002).
For urinary Na+ levels, there was a statistically significant fall in all groups vs sham control (SHAM BLADDER 141.7 mmol/L +/- 27.6 vs 3d UUO KIDNEY 75mmol/L +/- 23.8, p = 0.0016; SHAM BLADDER 141.7 mmol/L +/- 27.6 vs 3d UUO BLADDER 29.7mmol/L +/- 13.7, p = 0.002). There was no statistical differences in urinary Na+ between the BLADDER and KIDNEY urine of UUO animals, despite observed osmolality changes.
Regarding urinary K+ levels, there was a statistically significant drop from the UUO BLADDER to the UUO KIDNEY at both 3 and 10 days (3d UUO BLADDER 183.66mmol/L +/- 102.55 vs 3d UUO KIDNEY 62.2mmol/L +/- 23.84, p = 0.024; and 10d UUO BLADDER 236.2mmol/L +/- 46.19 vs 10d UUO KIDNEY 73.8mmol +/- 14.74, p = 0.001).
The most notable findings for urinary Cl- levels were the statistically significant difference between UUO BLADDER at 10 days and UUO BLADDER at 3 days, and also between UUO BLADDER at 10 days and UUO kidney at 10 days (10d UUO BLADDER 174mmol/L +/- 29.28 vs 3d UUO BLADDER 82mmol/L +/- 34.6, p<0.001; 10d UUO BLADDER 174mmol/L +/- 29.28 vs 10d UUO KIDNEY 44.2mmol/L +/- 11.03, p<0.001).
DISCUSSION
First and foremost, our model of UUO resulted in a pronounced hydronephrosis on the affected side, as would be expected. This is seen in Fig. (1), wherein the obstructed (L) kidneys have a greater wet weight and water content at 3 and 10 days than their cognate unobstructed (NL) kidneys, while the dry weight remains quite constant throughout. This is in keeping with other studies in pigs which show UUO causing a sizeable increase in the wet hydronephrotic kidney weight [18].
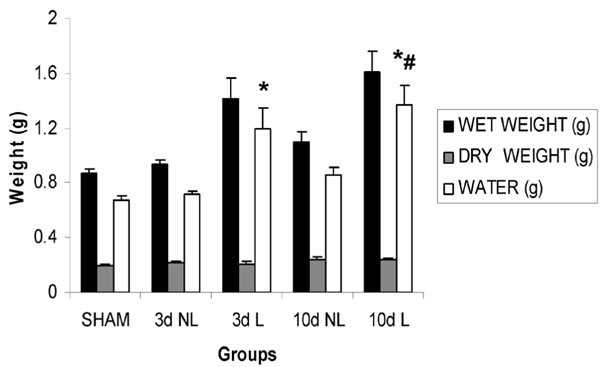
Relative tissue hydration in UUO. Kidneys from sham operated rats and kidneys from rats with 3 and 10 days of UUO respectively. Expressed as mean +/- standard deviation. SHAM = sham operated animal, 3d = 3 days, NL = non ligated, L = ligated, 10d = 10 days. *p<0.001 vs sham and time-matched NL kidney; #p<0.05 10 d L vs 3 d L.
Our results for plasma Na+, K+, urea and creatinine mirror that shown in similar studies, namely there being no change of note in Na+ or K+ (Table 1), but an impressive elevation in plasma urea and creatinine values, especially in light of the fact that the contralateral kidney is not suffering any marked acute injury (Figs. 2, 3) [17]. Unlike in acute renal failure proper, we do not observe a hyperkalemia of renal origin. The time frames involved in our study are actually longer than those used in other studies (3/10 days vs one day) [17]. We did not observe any significant alteration in plasma osmolality across experimental groups (Table 1). The deterioration in renal function evident from the plasma values may be explained by the fact that there is a lengthy lag period between the beginning of obstruction and completion of the full compensatory hypertrophy of the contralateral kidney required to adequately counter the reduction in functioning renal mass. Renal compensatory hypertrophy varies with post-nephrectomy time. For example, in one study, following nephrectomy for renal carcinoma, contralateral kidney enlargement was 15% in the first 3 months, reached a maximum 30% about a year later, and was reduced to 5% two and a half years postoperatively [19]. Furthermore, in rats, very few of the morphological adaptations of compensatory hypertrophy secondary to unilateral nephrectomy had completed their change by 10 days, the majority required longer [20].
Our comparative analyses of sham bladder, UUO bladder and obstructed pelvis urine was a revealing arm of the study in terms of examining urinary electrolyte and osmolality control in UUO. We sought to find an explanation for our major observation of a graded decrease in urinary osmolality from sham bladder to UUO bladder to obstructed renal pelvis urine (Fig. 4), in the urinary levels of individual major osmolytes.
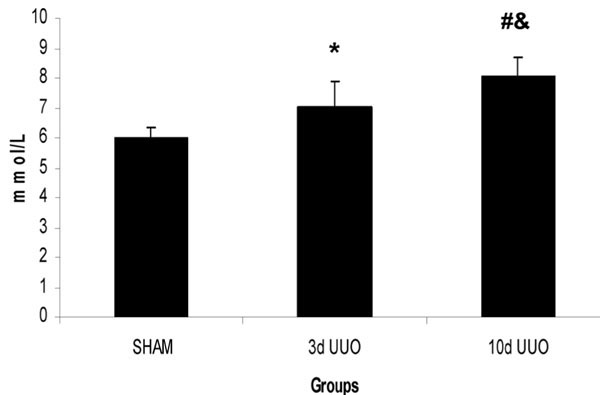
Plasma urea levels in UUO. Plasma urea in SHAM operated rats and rats with 3 and 10 days of UUO respectively. Expressed as mean +/- standard deviation. SHAM = sham operated animal, 3d = 3 days, UUO = unilateral ureteric obstruction, 10d = 10 days. *p<0.05 vs sham; #p<0.001 vs sham; &p<0.05 vs 3 d UUO.
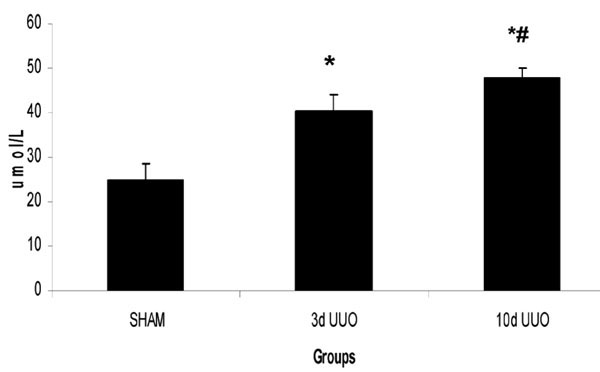
Plasma creatinine levels in UUO. Plasma creatinine in SHAM operated rats and rats with 3 and 10 days of UUO respectively. Expressed as mean +/- standard deviation. SHAM = sham operated animal, 3d = 3 days, UUO = unilateral ureteric obstruction, 10d = 10 days. *p<0.001 vs sham; #p<0.05 10 d UUO vs 3 d UUO.
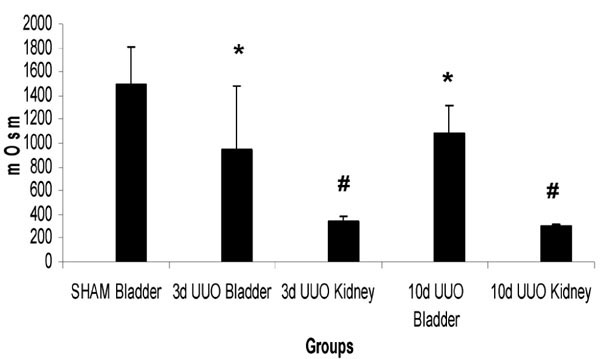
Urinary osmolality in UUO. Osmolalities of urine collected from the bladder of SHAM operated rats, from the bladder and obstructed kidney of rats with 3 days of UUO, and from the bladder and obstructed kidney of rats with 10 days of UUO. Expressed as mean +/- standard deviation. SHAM = sham operated animal, 3d = 3 days, UUO = unilateral ureteric obstruction, 10d = 10 days. *p<0.001 vs SHAM BLADDER; #p<0.05 vs cognate bladder urine.
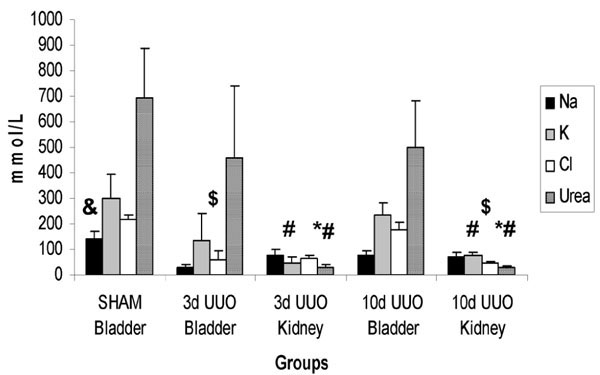
Urinary electrolyte and urea values in UUO. Electrolyte profiles of urine collected from the bladder of SHAM operated rats, from the bladder and obstructed kidney of rats with 3 days of UUO, and from the bladder and obstructed kidney of rats with 10 days of UUO. Expressed as mean +/- standard deviation. Na = sodium, K = potassium, Cl = chloride, SHAM = sham operated animal, 3d = 3 days, UUO = unilateral ureteric obstruction, 10d = 10 days. (*p<0.001 vs SHAM BLADDER; #p<0.05 vs cognate bladder urine; $p<0.001 vs 10d UUO BLADDER), &p<0.05 against all other groups.
Plasma Electrolyte and Osmolality Values in UUO
| SHAM | 3d UUO | 10d UUO | |
|---|---|---|---|
| Na(mmol/L) | 142.2 +/- 1.1 | 140.8 +/- 0.84 | 140.2 +/- 1.3 |
| K(mmol/L) | 4.2 +/- 0.58 | 4.38 +/- 0.33 | 4.34 +/- 0.47 |
| Cl(mmol/L) | 98.4 +/- 0.89 | 100.4 +/- 0.89 | 100 +/- 1.58 |
| Osmolality (mOsm) | 306.6 +/- 6.58 | 319.8 +/- 17.58 | 307.4 +/- 6.07 |
Plasma values for SHAM operated rats and rats with 3 and 10 days of UUO respectively. Expressed as mean +/- standard deviation. Na = sodium., K = potassium., Cl = chloride. SHAM = sham operated animal., 3d = 3 days., UUO = unilateral ureteric obstruction., 10d = 10 days
AVP resistance and reduced abundance of aquaporin water channels on the obstructed side has a major role in the defect in urinary concentration observed in UUO in rats by increasing free water clearance [21]. The downregulation of major renal Na+ and urea transporters in the obstructed kidney most probably exacerbates urinary dilution by providing an osmotic drag effect [13, 17].
Collecting system reabsorption of urea into the medullary interstitium is heavily involved in maintaining the interstitial osmotic gradient that underpins correct functioning of the countercurrent multiplier and urinary concentration [22]. Therefore, increased luminal and decreased interstitial concentrations of urea will contribute to increased urinary dilution independent of the loss of urea transporter expression. The net decrease in urea concentration despite evidence in the literature demonstrating decreased urea transporter expression in the urine from the obstructed pelvis reflects the magnitude of the diuretic response and also most likely the decrease in filtered urea load secondary to decreases in GFR [7, 13].
The contrasting intermediate osmolality of the contralateral, unobstructed kidney can be explained by a number of mechanisms. Firstly, it is known that there is an increase in contralateral kidney single nephron GFR [7]. This results in an increased urinary output. Secondly, it has previously been shown that there are reduced levels of the inner medullary Na-K-ATPase and cortical NaPi-2 cotransporter in the contralateral, unobstructed kidney during UUO which would promote a natriuretic response accompanying the increases in GFR [17]. Therefore decreases in the osmolality of urine from the non-obstructed kidney are influenced by a link between increases in GFR and reduced tubular Na+ reabsorption, which combine to produce an osmotic diuresis which ultimately masks analytical evidence of natriuresis. Interestingly, this diuretic effect is not associated with a similar magnitude of reduction in urinary urea concentrations, possibly reflective of a relative increase in filtered urea load in the non-obstructed kidney, secondary to increases in GFR. Finally, the relative maintenance of urinary urea concentrations in urine from the non-obstructed kidney vs obstructed kidney urine, may appear at first counter-intuitive, given that there is a loss of urea transporters only on the obstructed side [13]. However, aside from AVP resistance and aquaporin downregulation, we propose that correct functioning of urea transport on the contralateral side explains our finding that the diuretic response is relatively limited. In contrast, deranged urea handling on the obstructed side promotes an overwhelming diuresis by two principal mechanisms. The first mechanism relates to persistence of urea in the collecting duct lumen due to transporter downregulation in the obstructed kidney, acting as a strong osmotic attraction for water to stay in the lumen and be excreted. The other important factor is that reduced urea reabsorption depletes the medullary interstitial osmolality gradient, ultimately impeding normal functioning of the countercurrent multiplier. These systems are intact on the contralateral side and act to limit free water excretion. Of interest, in dogs, urinary osmolality was the parameter showing the most marked difference between the hydronephrotic and the contralateral kidney following ureteric obstruction [23].
Decreases in urinary K+ levels in the obstructed kidney likely reflect a reduced GFR rate and are also a product of urinary dilution [24]. Cl- excretion should be expected to increase in both the contralateral and obstructed kidneys, due to natriuresis. The dilutional effect of natriuresis reduces absolute Cl- concentrations in the urine, more markedly so in the 10 day UUO KIDNEY samples, due to sustained increases in free water clearance. Additionally, AVP resistance in the obstructed kidney of rats has been shown to reduce inward Cl-channel conductance in the thick ascending limb [25]. Of note, Cl- concentration of the urine did recover towards SHAM values in the 10d UUO BLADDER, suggestive of a reduced contralateral natriuresis by this timepoint, a point supported by a similar finding for Na+.
Of note, with reference to our findings, is the potential role played by the renin-angiotensin-aldosterone (RAA) system, which has a considerableinvolvement in the pathophysiology of UUO, as highlighted by the upregulation of plasma aldosterone levels secondary to 24 hours of UUO in rats [26]. Elsewhere, in pigs, it has been shown that there is an enhanced ipsilateral generation of intrarenal angiotensin II during UUO [27]. Given the knowledge that the RAA system typically acts to preserve sodium and water, we might be left to conclude that in the UUO model, the resistance to AVP and subsequent diuresis must represent a powerful signal that overrides the pressor effect of local increases in RAA system activity. However, it is very interesting to note, that in bilateral ureteric obstruction in rats, angiotensin II actually mediates downregulation of certain aquaporin water channels and key renal Na+ transporters [28]. This is an area which requires further investigation in a UUO model.
SUMMARY
We have made the following conclusions from these studies: i) UUO leads to hydronephrosis of the affected kidney with an increased wet kidney weight as previously described in the literature ii) UUO of up to 10 days duration is associated with a modest uraemia and elevated plasma creatinine levels in the absence of changes in plasma electrolyte profile iii) urinary osmolality is reduced in UUO in both obstructed and contralateral kidneys (this decrease is greater in the urine collected from the obstructed side) iv) an investigation of the urea and electrolyte composition of collected urine samples demonstrates evidence indicative of a diuresis/natriuresis in both kidneys with the increased dilution of the urine on the obstructed side being reflective of increases in free water excretion and failure of renal urea handling.
This study provides a structured interrogation of changes in urinary and plasma electrolyte profiles in UUO and links known molecular changes in UUO to alterations in renal function, characteristic of the pathology.

