All published articles of this journal are available on ScienceDirect.

Symptom Burden in Patients on Maintenance Haemodialysis: Magnitude, Associated Factors, Patients’ attitude and Practice
Authors Info & Affiliations
Abstract
Background:
Despite the enormous strides in haemodialysis technology and patient care in high-income countries, patients still experience a lot of symptoms which impair their quality of life (QoL). Data on symptom burden is lacking in low-income countries where the haemodialysis population is younger and access to care is limited.
Objectives:
To assess the symptom burden in patients on maintenance haemodialysis, its associated factors, patients’ attitude, and practice.
Materials and Methods:
All consenting patients on maintenance haemodialysis for at least 3 months in 2 referral hospitals in Yaoundé, Cameroon, were screened for symptoms. We excluded patients with dementia or those with acute illness. We used the Dialysis symptom index (DSI) and the modified Subjective Global Assessment tool to assess symptom burden and nutritional status, respectively. We analysed the data using Statistical Package for Social Science (SPSS) 26.0. A dialysis symptom index above the 75th percentile was considered a higher symptom burden.
Results:
we enrolled 181 participants (64.1% males) with a mean ±SD age of 46.46±14.19years. The median (IQR) dialysis vintage was 37[12-67.5] months and 37% (n=67) were on recombinant erythropoietin. All patients experienced at least a symptom with a median (IQR) of 12[8.0 – 16.0] symptoms per patient. Feeling tired/lack of energy (79%, n=143), decreased interest in sex (73.5%, n=133), dry skin (70.2%, n=127), difficulty becoming sexually aroused (62.4%, n=113), worrying (60.2%, n=109), bone/joint pain (56.4%, n=102), feeling nervous (50.8%, n=92), muscle cramps (50.8%, n=92) and dry mouth (50.3%, n=91) were the most frequent symptoms. The median (IQR) DSI severity score was 41[22.5-58.5] with 24.9% (n=45) having a higher symptom burden. Diabetes mellitus (AOR 5.50; CI 4.66-18.28, p=0.005), malnutrition (AOR 17.68; CI 3.02-103.59, p=0.001), poorly controlled diastolic blood pressure (AOR 4.19; CI 1.20-14.62, p=0.025) and less than 2 weekly sessions of dialysis (AOR 9.05, CI 2.83-28.91, p=<0.001) were independently associated with a higher symptom burden. Out of every 10 patients, 3 did not report their symptoms to the physicians with cost concern as the most reason (70.4%, n=38).
Conclusion:
In this young population where access to dialysis is limited, the symptom burden is high (100%). Active screening and management of enabling factors may reduce symptom burden and cost concern is the frequent reason symptoms are not reported to physicians.
1. INTRODUCTION
Chronic Kidney Disease (CKD), defined as structural and/or functional abnormalities of the kidney for more than 3 months with health implications [1], is a global public health problem that is associated with high mortality, excess morbidity and exuberant economic cost [2-4]. According to the 2017 Global Burden of Disease (GBD), CKD is the 16th cause of early death globally and is expected to rise to the 5th level by 2040 [5]. In its most severe form End-Stage Kidney Disease (ESKD), Kidney Replacement Therapy (KRT) becomes necessary for survival [5, 6]. It is estimated that 2.3-7.1 million people die of End-Stage Kidney Disease (ESKD) without access to chronic dialysis, and an entire 5-10 million die yearly from kidney disease [7, 8]. Moreover, 33 million Disability Adjusted Life Years (DALYS) have been attributed globally to kidney disease. Approximately 2.62 million received dialysis in 2012, with a double projection by 2030 [5, 9]. The annual cost per patient for HD ranged from $3,424-$42,785 in low- and middle-income countries [2, 10]. Despite national subsidization of the cost of haemodialysis by governmental funding, the average cost of haemodialysis per session in Sub-Saharan Africa is $100 [7]. Approximately 90% of patients on KRT in SSA are on Maintenance Haemodialysis (MHD) [7]. Although MHD is lifesaving and access to treatment has improved [11], these patients still experience many physical and psychological symptoms, with a mean of 6 – 20 symptoms per patient [12]. This array of ESKD symptoms contributes to the reduced Health-related quality of life (HRQoL) and high mortality seen in this patient population [4, 6, 13-17].
Patients on MHD experience a similar burden of symptoms as in other chronic conditions such as cancer and Acquired immune deficiency syndrome (HIV/AIDS) [6, 18, 19]. There is a high prevalence of symptoms, ranging from 7% - 92% [12]. Contributing factors such as accumulation of uremic toxins or fluids, metabolic derangements that are common in those with ESKD, complications of haemodialysis treatment pill burden and side effects of medications, the rigors of thrice-weekly dialysis sessions, high financial cost, the presence of other co-morbidities and lack of psychosocial support have been attributed to these symptoms [13, 15, 16]. Consequentially, these symptoms affect relationships at work and home, hence a high rate of divorce, job loss, sleeping disorders and poorly controlled blood pressure. Hence, the symptom burden is substantial and has a strong adverse inverse relationship with HRQoL [16, 20-22]. More so, these symptoms are often under-recognized by health caregivers and consequently undertreated; hence the severity, cost of treatment and care increase [16, 20]. Furthermore, to help reduce, relieve, and cope with these symptoms, these patients use complementary alternative medicines or cause premature termination of KRT [20]. Socio-demographic factors such as advanced age and female gender, clinical factors such as comorbidities, inadequate dialysis, and psychological factors have been attributed to these symptoms [3, 4]. However, these studies were done in areas with elderly patients with a mean age of above 60 years, who undergo 3 sessions of dialysis weekly and routinely use recombinant erythropoietin compared to those of SSA with a younger haemodialysis population, aged between 20-50 years [7], limited access to haemodialysis with the majority of their patients undergoing dialysis sessions twice weekly.
2. MATERIALS AND METHODS
2.1. Study Site
This study was done at two haemodialysis treatment centers in two tertiary hospitals in Yaoundé: The Yaoundé General Hospital (YGH) and the Yaoundé University Teaching Hospital (YUTH), from January to March 2020(2 months). Yaoundé is the political capital of Cameroon, a Central African country. It has a population of more than 4.1 million persons. Each hospital offers two dialysis sessions per patient weekly for a cumulative 8 hours of dialysis. Patients are followed by a complete team of nephrologists, internists, and residents. None of both health facilities has a psychologist nor a nutritionist. And the ratio between doctor and patient remains low.
2.2. Study Design and Target Population
The study was a hospital-based cross-sectional study in which data was obtained from all patients on chronic haemodialysis for at least three months in the YGH and YUTH. Data was obtained from 28th January to 29th May 2020.
2.3. Data Collection Tools
Each consenting participant was interviewed and physically examined, and their medical records were reviewed to complete the structured questionnaire.
The questionnaire consisted of 3 parts; the first part assessed the demographic characteristics of the population and their medical records, the second part consisted of the DSI tool, which assessed the frequency and severity of 30 symptoms (22 physical and 8 psychosocial symptoms), the attitude and practice towards symptoms of each participant. The perception of severity was graded on how bothersome the patient perceived the symptom using the 5-point Likert scale. There are YES/NO responses, and if YES, the amount of effect of the symptom was evaluated (1= not at all bothersome, 2= a little, 3= somewhat, 4= quite a bit, 5= very much). This gave a total score range of 0 - 150. The last part consisted of the mSGA tool, which assessed the nutritional status of the patients in seven components, each component scoring from 1 (normal) to 5 (very severe). A number between 7 (normal) and 35 (severely malnourished) sums up all of the components. A higher score indicates the presence of malnutrition elements, and a lower score denotes a tendency towards normal nutritional status.
2.4. Data Management and Analysis
All data collected were coded and stored on a computer. Data were entered in Microsoft Excel, clean and exported to Statistical Package for Social Sciences (SPSS) version 26.0. Descriptive and inferential statistics were done. Continuous variables were expressed as means, standard deviation, or median and quartiles for normally or skewed distribution. Categorical variables were summarized as frequency and proportions. We generated each patient's overall symptom severity score by summing the individual severity scores for all symptoms reported on the DSI. A score above the 75th percentile was considered a high symptom burden. Factors affecting the symptoms experienced were analysed using univariate and multivariate logistic regression, and P < 0.05 was considered statistically significant.
2.5. Ethical Considerations
Ethical approval for this study was obtained from the Institutional Review Board (IRB) of the Faculty of Health Sciences, University of Buea (Reference Number 2020/1048-01/UB/SG/IRB/FHS). Administrative authorization to carry out the research was obtained from Yaoundé General Hospital (Reference number: 214-20/HGY/DG/DPM/MA-TR) and the Yaoundé University Teaching Hospital (Reference number: 1999/AR/CHUY/DG/DGA/CAPRC).
2.6. Definition of Terms
Malnutrition: was determined according to a 7-point subjective global assessment score and defined as a total score > 11
Residual diuresis: was defined as residual urine volume 0f >100ml/24 hours
Physical handicap: was defined in any patient with hemiplegia or paraplegia, blindness or deafness
Cam use: current or past use of complementary or alternative medicine
Symptom burden: Symptom burden is defined in this study as a subjective, quantifiable frequency and severity of symptoms placing a physiologic burden on patients producing multiple negative physical and emotional responses.
Symptom Severity: DSI severity score per symptom on 5: based on the patient’s degree to which the symptom was bothersome.
Bothersome: The degree to which that symptom causes the patient difficulty or the degree to which the patient perceives that symptom to be important
3. RESULTS
3.1. Socio-Demographic Characteristics of the Study Population
Out of the 181 participants enrolled, 64.1% were males (n=116). The age of the participants ranged from 10 to 76 years with a mean age of 46.46 ± 14.19years; 80% (n=145) were younger than 60years. Female patients were significantly younger (p=0.040). Furthermore, 59.1% of the participants were married (n=107), 33.1% were unemployed (n=60), and 74% had at least secondary education (n=134). The median social support score was 4.88[4.25-5.00], and 51.9% (n=94) of participants self-funded the cost of HD treatment (Table 1).
3.2. Frequency and Severity of Symptoms in this Study Population using the Dialysis Symptom Index tool (DSI)
All 181(100%) participants experienced at least a symptom. The number of symptoms ranged from 1 to 24, with a median [IQR] of 12[8.0-16.0] symptoms per patient (Table 2). In all, 86.2% (n=156) expressed at least one symptom as “very much bothersome,” with a median [IQR] of 3 [2-6] symptoms reported as “very much bothersome” per patient.
| Variable | Total N=181 |
Male n=116 |
Female n=65 |
P-Value |
| Mean age ± SD years | 46 ± 14.19 | 49.56 ± 14.49 | 40.92 ± 15.40 | <0.001 |
| Age (years) | ||||
| <60 n (%) | 145(80.1%) | 88(75.9 %) | 57(87.7%) | 0.040 |
| ≥60 n (%) | 36(19.9%) | 28(24.1%) | 8(12.3%) | |
| Marital status | ||||
| Never married n (%) | 48(26.5%) | 22(19%) | 26(40.0%) | |
| Married n (%) | 107(59.1%) | 82(70.7%) | 25(38.5%) | <0.001 |
| Widow/widower n (%) | 10(5.5%) | 2(1.7%) | 8(12.3%) | |
| Divorced n (%) | 16(8.8%) | 10(8.6%) | 6(9.2%) | |
| Occupation | ||||
| Unemployed n (%) | 60(33.1%) | 31(26.7%) | 29(44.6%) | |
| Employed n (%) | 72(39.8%) | 57(49.1%) | 15(23.1%) | <0.001 |
| Housewife n (%) | 4(2.2%) | 0(0.0%) | 4(6.2%) | |
| Retired n (%) | 37(20.4%) | 28(24.1%) | 9(13.8%) | |
| Student n (%) | 8(4.4%) | 0(0%) | 8(12.3%) | |
| Level of formal education | ||||
| ≥ Secondary education | 134(74.0%) | 96(82.8%) | 38(58.5%) | <0.001 |
| Source of funding | ||||
| Self – funding alone | 94(51.9%) | 73(62.9%) | 21(32.3%) | <0.001 |
| Variable | Total |
| Median [IQR] number of symptoms | 12[8.0 – 16.0] |
| At least 1 symptom as “very much bothersome” n (%) | 156(86.2%) |
| Median [IQR] number of symptoms reported as “very much bothersome” | 3[2 – 6] |
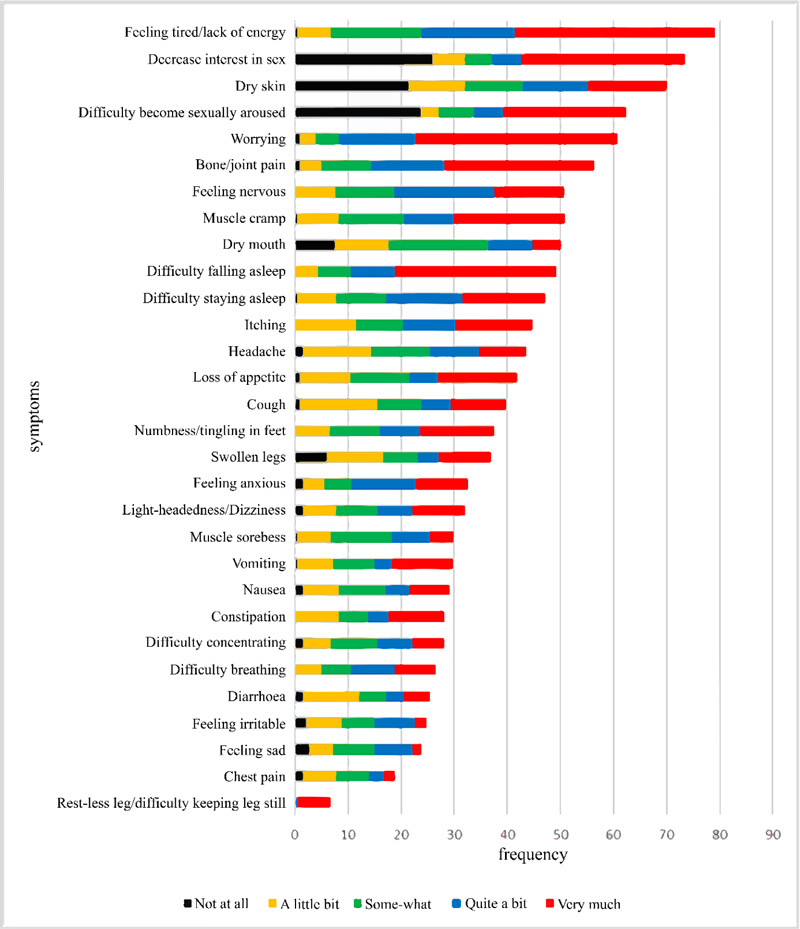
3.3. Types of Symptoms Experienced by Patients with MHD (Fig. 1)
About 33% (n=60) of the participants reported symptoms not found on the DSI questionnaire (Table 3). The most frequent symptoms reported were feeling tired (n=143, 79%), decreased interest in sexual activity (n=133, 73.5%), dry skin (n=127, 70.2%), difficulty becoming sexually aroused (n=113, 62.4%), worrying (n=109, 60.2%), bone/joint pain (n=102, 56.4%), Feeling nervous (n=92, 50.8%), muscle cramps (n=92, 50.8%) and dry mouth (n=91, 50.3%). However, Restless leg syndrome was reported as the most severe (4.92 ± 0.29) with the DSI although the least frequent (n=12, 6.6%).
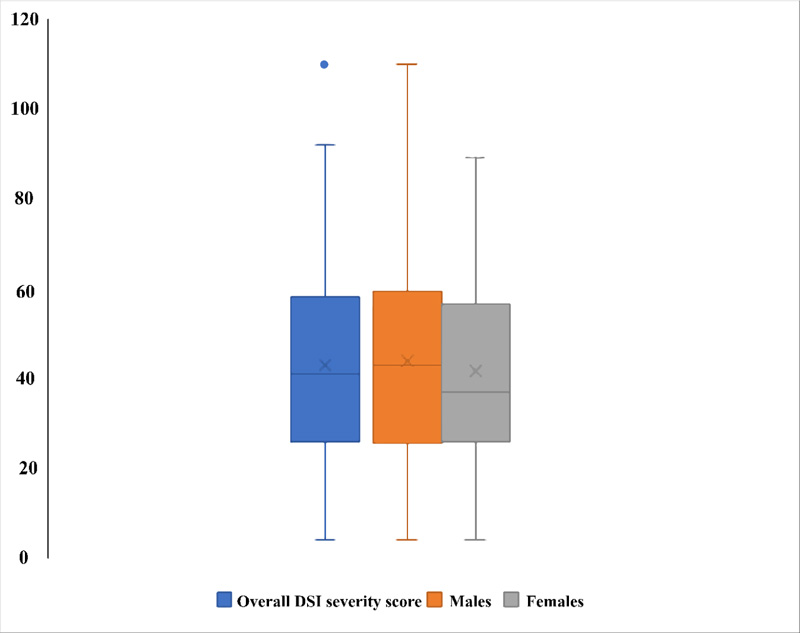
3.4. The Dialysis Symptom Index (DSI) Severity Score According to Sex (Fig. 2)
The median [IQR] overall dialysis symptom index severity score was 41[25.5 – 58.5]. Males had a higher DSI severity score (42.50[24.25 – 59.75]) compared to females (37 [26-57]), although this was not statistically significant (p = 0.514). A DSI severity score above the 75th percentile was considered a higher symptom burden, and 45 (24.9%) participants had a higher symptom burden.
| Variable | Frequency (n) | Percentage % |
| Twitches | 13 | 7.2 |
| Hyperpigmentation of the skin | 9 | 5.0 |
| Abdominal distension | 7 | 3.9 |
| Abdominal pain | 5 | 2.8 |
| Heat flush | 5 | 2.8 |
| Generalised tingling sensation | 4 | 2.2 |
| Excessive salivation | 3 | 1.7 |
| Tooth ache | 3 | 1.7 |
| Bloating | 3 | 1.7 |
| Others | 8 | 4.4 |
| Variable | Symptom burden | OR | 95% CI | P - Value | |
| Low Burden | High Burden | ||||
| Age (years) | |||||
| <55 | 89(65.4%) | 32(71.1%) | 0.77 | 0.37-1.61 | 0.585 |
| ≥55 | 47(34.6%) | 13(28.9%) | |||
| Sex Male | 86(63.2%) | 30(66.7%) | |||
| Female | 50(36.8%) | 15(33.3%) | 0.86 | 0.42 – 1.75 | 0.723 |
| Level of formal education | |||||
| < Secondary | 35(25.7%) | 12(26.7%) | |||
| ≥ Secondary | 101(74.3%) | 33(73.3%) | 0.95 | 0.44 – 2.05 | 1.000 |
| Source of funding | |||||
| Self | 69(50.7%) | 25(55.6%) | 1.21 | 0.61 – 2.39 | 0.609 |
| Others | 67(49.3%) | 20(44.4%) | |||
3.5. Factors Associated with a Higher Symptom Burden
3.5.1. Socio-Demographic Characteristics Associated with a Higher Symptom Burden (Table 4)
On univariate analysis, there was no association between age, sex, level of formal education, or source of funding and a higher symptom burden.
3.5.2. Clinical Factors Associated with a Higher Symptom Burden in this Study (Table 5)
On univariate analysis, 3 or more comorbidities (OR 2.61, 95% CI 1.10 - 6.21), less than 2 weekly dialysis sessions (OR 11.29, 95% CI 4.61 – 27.66), a dialysis vintage of fewer than 60 months (OR 2.78, 95% CI 1.15 – 6.70), Diabetes Mellitus (OR 2.86, 95% CI 1.33 - 6.15), Physically handicapped (OR 3.25, 95% CI 1.28-8.37) and malnutrition (OR 6.5,95% CI 1.9 - 22) was associated with a higher symptom burden (p<0.05). Anaemia defined as haemoglobin level <10, did not correlate with a higher symptom burden.
3.5.3. Some Clinical Parameters and Medications used were Associated with a Higher Symptom Burden in this Study Population (Table 6)
On univariate analysis, Vitamin B supplement use (OR 2.69, 95% CI 1.3 - 5.6), poorly controlled mean monthly pre-dialysis SBP (OR 2.24, 95%CI 1.08 - 4.64) and poorly controlled mean monthly pre-dialysis DBP (OR 3.16, 95% CI 1.41 - 7.11) was associated with a higher symptom burden (p < 0.05) whereas, taking recombinant erythropoietin (OR 0.4, 95% CI 0.18 - 0.87) was found to be protective (p < 0.05).
3.5.4. Factors Associated with a Higher Symptom on Multivariate Analysis (Table 7)
After adjustment, less than two dialysis sessions weekly (AOR 9.05, p-value <0.001), poorly controlled mean pre-dialysis DBP (AOR=4.19, p=0.025), Diabetes Mellitus (AOR =5.50, p=0.005) and malnutrition (AOR=17.68, p value=0.001) were independently associated with a higher symptom burden.
Table 5.
| Variable | Symptom Burden | OR | 95% CI | p-Value | |
| Low Burden | High Burden | ||||
| Number of comorbidities | |||||
| ≥3 | 15(11.0%) | 11(24.4%) | 2.61 | 1.10 - 6.21 | 0.047 |
| <3 | 121(89%) | 34(75.6%) | |||
| Weekly sessions | |||||
| <2 | 9(6.6%) | 20(44.4%) | 11.29 | 4.61 – 27.66 | <0.001 |
| ≥2 | 127(93.4%) | 25(55.6%) | |||
| HD vintage | |||||
| <60 months | 90(66.2%) | 38(84.4%) | 2.78 | 1.15 – 6.70 | 0.023 |
| ≥60 months | 46(33.8%) | 7(15.6%) | |||
| DM | |||||
| Yes | 22(16.2%) | 16(35.6%) | 2.86 | 1.33 - 6.13 | 0.010 |
| No | 114(83.8%) | 29(64.4%) | |||
| Physical handicap | |||||
| Yes | 11(8.1%) | 10(22.2%) | 3.25 | 1.28 - 8.27 | 0.016 |
| No | 125(91.9%) | 35(77.8%) | |||
|
Anemia(Hb<10 g/)
Yes no Chronic viral infections |
123(90.5%)
13 (9.5%) |
37(82.3%)
08(17.7%) |
2.03 | 0.72- 3.25 | 0.104 |
| Yes | 22(16.2%) | 9(20.0%) | 1.30 | 0.55 - 3.07 | 0.648 |
| No | 114(83.8%) | 36(80.0%) | |||
| Nutritional status | |||||
| Malnutrition | 93(68.4%) | 42(93.3%) | 6.47 | 1.90 - 22.05 | 0.001 |
| Well nourished | 43(31.6%) | 3(6.7%) | |||
| Vascular access | |||||
| CVC | 14(10.3%) | 8(17.8%) | 1.88 | 0.73 – 4.84 | 0.194 |
| AVF | 122(89.7%) | 37(82.2%) | |||
| Variable | Symptom Burden | OR | 95%CI | p- Value | |
| Low Burden | High Burden | ||||
| Erythropoietin | |||||
| Yes | 57(41.9%) | 10(22.2%) | 0.4 | 0.18-0.87 | 0.021 |
| No | 79(58.1%) | 35(77.8%) | |||
| CAM use | |||||
| Yes | 67(49.3%) | 18(40.0%) | 0.69 | 0.35-1.36 | 0.31 |
| No | 69(50.7%) | 27(60%) | |||
| Vitamin B supplement | |||||
| Yes | 65(47.8%) | 32(71.1%) | 2.69 | 1.3-5.6 | 0.009 |
| No | 71(52.2%) | 13(28.9%) | |||
| Residual diuresis | |||||
| No | 87(64.0%) | 29(64.4%) | 1.02 | 0.51-2.06 | 1.000 |
| Yes | 49(36.0%) | 16.(35.6%) | |||
| Mean SBP mmHg | |||||
| Poor control | 29(21.3%) | 17(37.8%) | 2.24 | 1.08-4.64 | 0.047 |
| Good control | 107(78.7%) | 28(62.2%) | |||
| Mean DBP mmHg | |||||
| Poor control | 17(12.5%) | 14(31.1%) | 3.16 | 1.41-7.11 | 0.006 |
| Good control | 119(87.5%) | 31(68.9%) | |||
| Variable | OR (95% CI) | AOR | 95% CI | Adjusted p-Value |
| ≥3 comorbidities | 2.61(1.10-6.21) | 1.76 | 0.38 – 8.14 | 0.471 |
| <2 weekly sessions | 11.29(4.61-27.66) | 9.05 | 2.83 – 28.91 | <0.001 |
| HD vintage<60 months | 2.78(1.15-6.70) | 2.49 | 0.83 – 7.48 | 0.104 |
| Poorly controlled mean SBP | 2.24(1.08-4.64) | 1.42 | 0.46 – 4.32 | 0.542 |
| Poorly controlled mean DBP | 3.16(1.41-7.11) | 4.19 | 1.20 – 14.62 | 0.025 |
| DM | 2.86(1.33-6.13) | 5.50 | 1.66 – 18.28 | 0.005 |
| Physical handicap | 3.25(1.28-8.27) | 3.05 | 0.71 – 13.06 | 0.133 |
| Ma1nutrition | 6.47(1.90-22.05) | 17.68 | 3.02 – 103.59 | 0.001 |
| Erythropoietin use | 0.4(0.18-0.87) | 0.38 | 0.14 – 1.01 | 0.052 |
| Vitamin B use | 2.69(1.30-5.60) | 1.74 | 0.67 – 4.50 | 0.253 |
| Variable | Frequency (n) | Percentage (%) |
| Participants who did not report symptoms to attending physician | 54 | 29.8 |
| Reasons participants did not report symptoms | ||
| Scared of cost of laboratory investigation and drugs | 38 | 70.4 |
| Could-self manage symptoms | 16 | 29.6 |
3.6. Patients’ Attitudes and Practice on Symptoms (Table 8)
About 30% (n=54) of the participants did not report their symptoms to their doctor, and the reasons for not reporting symptoms were; 70.4% (n=38) were scared of the cost of drugs and paraclinical investigations, only 29.6% (n=16) felt they could manage symptoms themselves.
4. DISCUSSION
End-stage kidney disease and its management, especially by haemodialysis, is associated with physical and psychological symptoms that adversely affect the quality of life. In this study, we sought to evaluate the symptom burden and its associated factors and describe the attitude and practice of patients towards symptoms. All participants experienced symptoms with a median [IQR] of 12 [8.0 – 16.0] symptoms per patient and 156 (86.2%) reporting at least a symptom as “very much bothersome”; 9 symptoms were reported by at least 50% of the patients; a median [IQR] overall symptom severity score of 41 [22.5-58.5] with no significant difference in sex and 45(24.9%) patients had a higher symptom burden; diabetes mellitus (AOR=5.50, CI 4.66-18.28), malnutrition (AOR= 17.68, CI 3.02-103.59), less than 2 weekly sessions of HD(AOR=11.29, CI 4.61-27.66) and poor pre-dialysis DBP control (AOR=4.19, CI 1.20-14.62) were independently associated with a higher symptom burden; for every 10 participants, 3 did not report their symptoms to the treating physician with cost-concern (70.4%, n=38) being the main reason.
The reported average number of symptoms experienced by patients with MHD varies from 6 - 20 symptoms depending on the symptom assessment tools used, the characteristics of participants, settings and cultural background [12, 23]. Our results found an average of 12 symptoms, which is in line with the above review and similar to the average number of symptoms experienced in the AIDS and terminal cancer population when symptom assessment instruments similar in content and length to the DSI were used [18, 19]. We found a higher average number of symptoms compared to what was reported in Switzerland (12 vs. 10) and America (12 vs. 9) [23, 24]. This observed difference could be related to the fact that the majority of our participants were dialyzed compared to high-income countries (HIC), where 80% underwent haemodialysis at least thrice weekly. However, our results were lower than those reported in Italy [23]; this observed difference can be justified by our lower median dialysis vintage and our younger population. Advance age comes with physiologic deterioration in health and is additive to the chronic complications of haemodialysis that develop with time, both predisposing to a higher prevalence of physical symptoms such as fatigue and bone/joint pain. Compared to our lower dialysis vintage (37 vs. 79 months) and young population (46 vs. 63 years).
Physical and emotional symptoms are frequent in patients with MHD, varying from 7% to 92%, as reported in a review study [12]. We observed 9 most frequent symptoms, 7 physical symptoms, and 2 psychological. Feeling tired/lack of energy was the most frequent symptom; this was in line with what was reported by Almutary et al. in a review study in 2013, where feeling tired was the most frequently reported symptom with a prevalence ranging from 49-100% irrespective of the stage of CKD [12]. This observed similarity could be explained by the fact that other than the effects of carnitine deficiency and overproduction of proinflammatory cytokines cause energy depletion in HD patients. We also observed that psychological symptoms (worrying and nervousness) were frequent. This is consistent with the results reported in a review study by Almutary et al. in 2013 [12]. This observed similarity could be due to the adverse socio-economic changes that occur in patients after initiation of MHD despite improved access to treatment [24]. However, our result was higher than reported in Switzerland, Turkey and America [20, 23, 25]. This observed difference is explained by the high out-of-pocket cost of HD treatment in our setting despite government subsidization [2]. Like many LMIICs, despite HD treatment subsidization, out-of-pocket costs remain extremely high [10]. Moreover, in our young population, only about a third were employed, with most still having dependent roles to fulfill compared to those of HIC, whose treatment is completely subsidized and has an old and retired population. Furthermore, we found sex-related symptoms frequent and severe; this was, however, contrary to what was found by Almutary et al. in a review, where the frequency varied between 0-61% [12]. Our high frequency was similar to a study reported earlier in Cameroon by Teuwafeu et al. in 2016, where he reported a 94% prevalence of sexual dysfunction in HD patients [26]. Moreover, there has been a trend for black people to report more sexual symptoms [13]. This was contrary to that reported in Turkey, Switzerland and America [13, 20, 24]. This observed difference is explained by our young population, with more than half of them married; hence, they tend to place greater importance on their sexual life and sexual satisfaction. We, however, had a similar prevalence with the Italian patients [23]. Our similar culture explains this observed similarity in placing importance on sexual activity and satisfaction. Hence sexual dysfunction will have a greater impact on our patients. However, we observed a lower frequency of symptoms found higher in other studies, specifically itching [12, 13, 20]. Other than the sensitization linked to vascular access cleansing solutions, hyperphosphatemia from nonadherence to a prescribed diet has been linked to itching in this patient population [27]. This low prevalence could be due to the poor nutritional status of our participants (98%, n=178) who, due to diet restrictions, avoid meals rich in phosphate and calcium contrary to those of HIC countries, with regular HD sessions which have a lesser degree of diet restriction. Several symptoms were reported as severe. Other than restless leg syndrome, which was the least prevalent, many of the most prevalent symptoms were reported to be severe. Furthermore, the DSI tool did not contain all symptoms experienced by this patient- population since 60 (34%) of the participants reported other symptoms.
The overall DSI score represents the severity of all 30 symptoms. In this study, we found a higher overall DSI severity score compared to that reported in Switzerland(32), the United States of America (22) and Italy (25) [23, 24]. This observed difference could be explained by the fact that most of our patients undergo 2 sessions weekly, only one-third of them take erythropoietin, and our young population tends to pay greater attention to their health since young people have higher expectations in terms of the quality of life. It is known that the severity of some symptoms, such as psychological and sex-related symptoms, which were frequent in our study, is associated with younger age [28]. Also, 26 of our reported symptoms had a symptom severity score of 3 or higher (moderate severity) compared to 18 in Switzerland, 8 in Turkey, 12 in America and 14 in Italy [20, 23, 24]. There was no significant difference in the median DSI severity score between the sexes. This is contrary to previous studies where the female sex was associated with a high mean DSI score [13, 20, 28, 29]
In consonance with previous studies, we found diabetes mellitus associated with a higher symptom burden. DM and its chronic complications of peripheral neuropathy and vascular complications could lead to symptoms such as restless leg syndrome, numbness, and difficulty becoming sexually aroused [16, 20]. In addition to the pill burden accompanying it, diabetes mellitus contributes to the severity of these symptoms. However, Weisbord et al. found no association between symptom burden and DM [13]. The observed difference is limited by the fact that the characteristics of their diabetes population are unknown to make the comparison. Furthermore, we observed an association with malnutrition, poor pre-dialysis DBP, and less than 2 sessions of dialysis weekly. Nutrition plays a role in the functional capacity of patients, hence malnutrition due to restriction of fluid and dietary intake, as well as the presence of chronic inflammatory process [30] affects the presence of physical symptoms such as feeling tired, dry mouth, dry skin, difficulty falling and staying asleep and lack of concentration thereby increasing the burden of symptoms. Moreover, symptoms like anorexia and vomiting will lead to inadequate intake as well as the catabolic effects of haemodialysis, leading to malnutrition. Moreover, less than 2 sessions of dialysis weekly were independently associated with a higher symptom burden. No difference has been found between 2 or 3 weekly sessions in the effective removal of uremic toxins and electrolyte balance, hence adequate HD treatment [31]. However, due to high costs in Africa, access to health care is limited. Despite the highly subsidised dialysis treatment in the country, the cost of dialysis is out of reach for most patients causing the patient to undergo less than 2 sessions. Less than 2 weekly sessions imply inadequate removal of toxins, increasing the frequency and severity of uremic symptoms such as tiredness, difficulty falling and staying asleep, joint/bone pain, nausea, and vomiting due to increasing symptom burden. Furthermore, we observed an association between poor pre-dialysis DBP control and a higher symptom burden. Isolated poor pre-dialysis DBP control is an indication of poorly controlled blood pressure, which is a sign of volume overload in patients undergoing MHD and sometimes, implying underdialysis. DBP is the pressure exerted on the blood vessels while the heart is at rest and is not distorted by pressure distortion [32]. Its elevation has been associated with arterial stiffness and an increased risk of cardiovascular diseases due to atherosclerosis formation. Hence, poorly controlled DBP will influence the frequency and severity of symptoms such as headaches, feeling tired, and chest pain, therefore increasing the frequency and severity of these symptoms and increasing symptom burden. Contrary to previous reports, we found no association between higher symptom burden and age, sex, level of education, anuria, and type of vascular access [20, 28, 29]. This observed difference could be due to our statistically small range of data of patients represented in the groups and we considered a higher symptom burden above the 75th percentile.
Symptoms experienced by this patient population often go unrecognized and under-managed [33-35]. In our study, 3 out of 10 patients did not report their symptoms to their treating physician because of the fear of the cost of drugs and paraclinical investigations (70.4%, n=38) being the main reason. Direct medical costs, especially drugs and consumables for HD, are the main cost drivers in LMIC [10]. In Cameroon, 30% of the direct medical cost is reported to be out-pocket, which amounts to $4,114 annually [5].
LIMITATIONS AND STRENGTHS
Our study had the following limitations
1. Symptom assessment was limited to symptoms on the dialysis symptom index tool; hence the burden might have been underestimated.
2. We did not assess the influence of laboratory parameters such as serum calcium, serum phosphate, parathyroid hormone level, C-reactive protein, and symptom burden in this study population.
3. Our study is limited to two centers in the capital city which might not reflect other peripheral centers. However, the practice of haemodialysis is uniform in the country and consists of patients of different social statuses.
Furthermore, our study had the following strengths:
1. To the best of our knowledge, it is the first study in Cameroon that has assessed a wide range of physical and psychological symptoms experienced by patients on MHD and provides additional knowledge for patient-centered care and improvement of quality of life.
2. It involved everybody undergoing haemodialysis, including children in these two centers, that constitute half of the dialysis population in Cameroon.
CONCLUSION
There is a high symptom burden in patients with HD. Physical and psychological symptoms are frequent and severe in this patient population, with limited access to care. At least 12 symptoms are experienced per patient, with an overall severity score of 41. Preventable factors are independently associated with a higher symptom burden, and cost concern is the most reason symptoms are not being reported. Active screening and management of enabling factors may reduce symptom burden.
LIST OF ABBREVIATIONS
| QoL | = Quality of life |
| DSI | = Dialysis symptom index |
| SPSS | = Statistical Package for Social Science |
| DSI | = Dialysis symptom index |
AUTHORS’ CONTRIBUTIONS
DT, AC, MM, and GA were entirely responsible for the conception and design of the study. Moreover, DT, AC, and GA designed data collection tools, collected and monitored data for the whole trial, as well as cleaned, analysed and interpreted the data. DT drafted the manuscript and then revised the paper to produce the final manuscript. All authors read and approved the final manuscript.
ETHICS APPROVAL AND CONSENT TO PARTICIPATE
Ethical approval for this study was obtained from the Institutional Review Board (IRB) of the Faculty of Health Sciences, University of Buea (Reference Number 2020/1048-01/UB/SG/IRB/FHS). Administrative authorization to carry out the research was obtained from Yaoundé General Hospital (Reference number: 214-20/HGY/DG/DPM/MA-TR) and the Yaoundé University Teaching Hospital (Reference number: 1999/AR/CHUY/DG/DGA/CAPRC).
HUMAN AND ANIMAL RIGHTS
No animals were used for studies that are based on this research. The reported experiments were performed in accordance with the Helsinki Declaration of 1975.
CONSENT FOR PUBLICATION
Informed consent was obtained from all participants involved in the study.
STANDARDS OF REPORTING
STROBE guidelines were followed.
AVAILABILITY OF DATA AND MATERIALS
Not applicable.
CONFLICT OF INTEREST
The authors declared no conflict of interest.
FUNDING
None of the authors received any formal funding for this study. There was also no formal funding for the design, collection, analysis, and interpretation of data, the writing of the manuscript or the decision to submit the manuscript for publication.
ACKNOWLEDGEMENTS
Declared none.

